29
/pt/
pt
AIzaSyAYiBZKx7MnpbEhh9jyipgxe19OcubqV5w
April 1, 2024
56976
South Asia
SAS
false
2
1
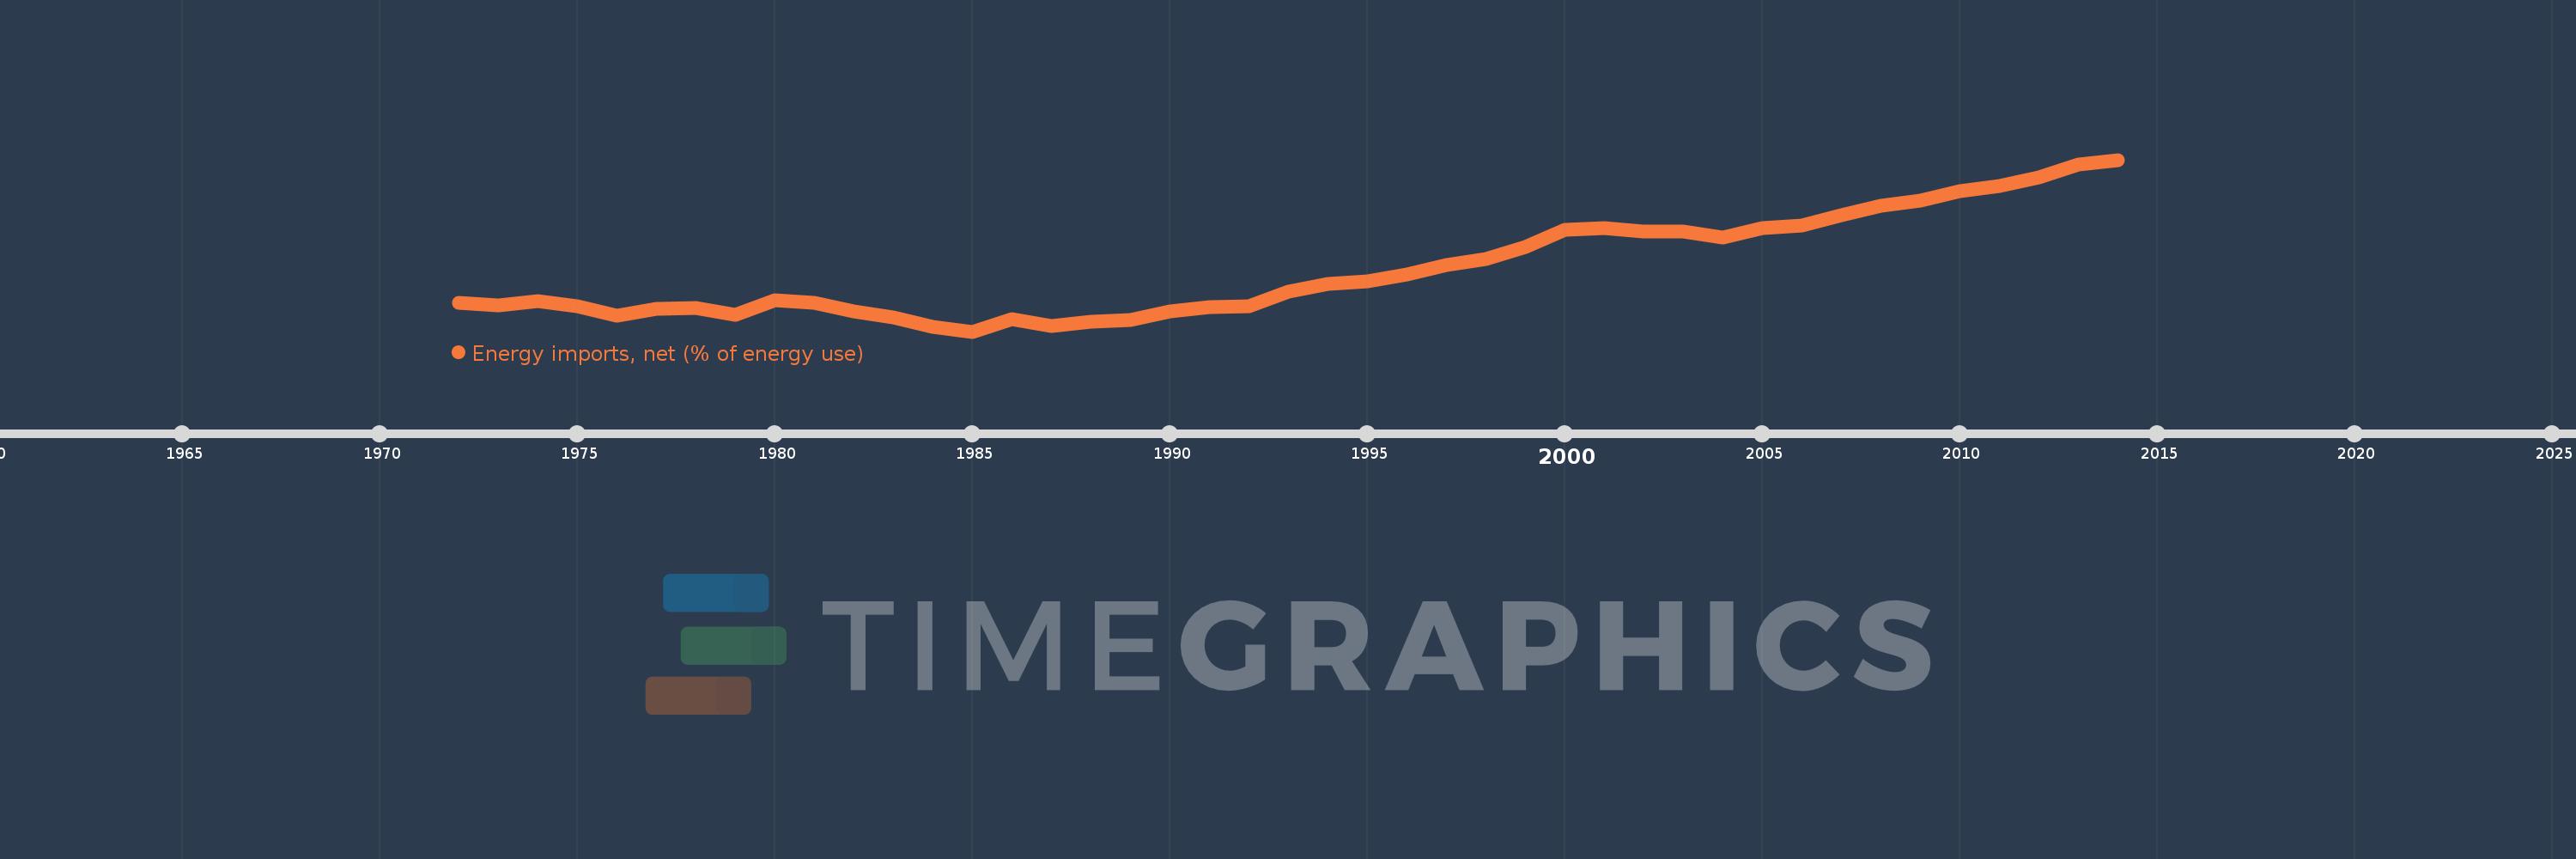
Energy imports, net (% of energy use)
2014,2013,2012,2011,2010,2009,2008,2007,2006,2005,2004,2003,2002,2001,2000,1999,1998,1997,1996,1995,1994,1993,1992,1991,1990,1989,1988,1987,1986,1985,1984,1983,1982,1981,1980,1979,1978,1977,1976,1975,1974,1973,1972
Estas estatísticas em outros países:
AlbaniaAlgeriaAngolaArab WorldArgentinaArmeniaAustraliaAustriaAzerbaijanBahrainBangladeshBelarusBelgiumBeninBoliviaBosnia and HerzegovinaBotswanaBrazilBrunei DarussalamBulgariaCambodiaCameroonCanadaCaribbean small statesCentral Europe and the BalticsChileChinaColombiaCongo, Dem. Rep.Congo, Rep.Costa RicaCote d'IvoireCroatiaCubaCuracaoCyprusCzech RepublicDenmarkDominican RepublicEarly-demographic dividendEast Asia & PacificEast Asia & Pacific (excluding high income)East Asia & Pacific (IDA & IBRD countries)EcuadorEgypt, Arab Rep.El SalvadorEritreaEstoniaEthiopiaEuro areaEurope & Central AsiaEurope & Central Asia (excluding high income)Europe & Central Asia (IDA & IBRD countries)European UnionFinlandFragile and conflict affected situationsFranceGabonGeorgiaGermanyGhanaGibraltarGreeceGuatemalaHaitiHeavily indebted poor countries (HIPC)High incomeHondurasHong Kong SAR, ChinaHungaryIBRD onlyIcelandIDA & IBRD totalIDA blendIDA onlyIDA totalIndiaIndonesiaIran, Islamic Rep.IraqIrelandIsraelItalyJamaicaJapanJordanKazakhstanKenyaKorea, Dem. People’s Rep.Korea, Rep.KosovoKuwaitKyrgyz RepublicLate-demographic dividendLatin America & Caribbean Latin America & Caribbean (excluding high income)Latin America & the Caribbean (IDA & IBRD countries)LatviaLeast developed countries: UN classificationLebanonLibyaLithuaniaLow & middle incomeLow incomeLower middle incomeLuxembourgMacedonia, FYRMalaysiaMaltaMauritiusMexicoMiddle East & North AfricaMiddle East & North Africa (excluding high income)Middle East & North Africa (IDA & IBRD countries)Middle incomeMoldovaMongoliaMontenegroMoroccoMozambiqueMyanmarNamibiaNepalNetherlandsNew ZealandNicaraguaNigerNigeriaNorth AmericaNorwayOECD membersOmanOther small statesPakistanPanamaParaguayPeruPhilippinesPolandPortugalPost-demographic dividendPre-demographic dividendQatarRomaniaRussian FederationSaudi ArabiaSenegalSerbiaSingaporeSlovak RepublicSloveniaSmall statesSouth AfricaSouth AsiaSouth Asia (IDA & IBRD)South SudanSpainSri LankaSub-Saharan Africa Sub-Saharan Africa (excluding high income)Sub-Saharan Africa (IDA & IBRD countries)SudanSwedenSwitzerlandSyrian Arab RepublicTajikistanTanzaniaThailandTogoTrinidad and TobagoTunisiaTurkeyTurkmenistanUkraineUnited Arab EmiratesUnited KingdomUnited StatesUpper middle incomeUruguayUzbekistanVenezuela, RBVietnamWorldYemen, Rep.ZambiaZimbabwe Linha do tempo:
Nesta escala de tempo está apresentado um gráfico de 1972 ano até 2014 ano South Asia. Dados de 1971 ano ausente. O número de observações reais por data: 43.
Fonte (nome):
Indicadores de desenvolvimento mundial
Fonte (organização):
IEA Statistics © OECD/IEA 2014 (http://www.iea.org/stats/index.asp), subject to https://www.iea.org/t&c/termsandconditions/
Categorias:
Energy & Mining, Trade
Foi atualizado:
23 abr 2017 ano
Indicadores de alterações dos valores ao longo dos anos
Mínimo:
6.522
1 jan 1985 ano
Máximo:
31.06
1 jan 2014 ano
Na data de observação
Valor
Mudança absoluta
A alteração em relação ao valor anterior
1 jan 1972 ano
10.638
+10.638
0.0%
1 jan 1973 ano
10.254
-0.384
-3.61%
1 jan 1974 ano
10.831
+0.578
5.63%
1 jan 1975 ano
10.167
-0.664
-6.13%
1 jan 1976 ano
8.74
-1.427
-14.04%
1 jan 1977 ano
9.749
+1.008
11.54%
1 jan 1978 ano
9.841
+0.092
0.94%
1 jan 1979 ano
8.854
-0.987
-10.03%
1 jan 1980 ano
11.037
+2.183
24.66%
1 jan 1981 ano
10.662
-0.375
-3.4%
1 jan 1982 ano
9.421
-1.24
-11.63%
1 jan 1983 ano
8.527
-0.895
-9.5%
1 jan 1984 ano
7.151
-1.375
-16.13%
1 jan 1985 ano
6.522
-0.629
-8.8%
1 jan 1986 ano
8.259
+1.737
26.63%
1 jan 1987 ano
7.352
-0.907
-10.98%
1 jan 1988 ano
7.959
+0.607
8.25%
1 jan 1989 ano
8.185
+0.226
2.83%
1 jan 1990 ano
9.363
+1.178
14.4%
1 jan 1991 ano
10.043
+0.68
7.26%
1 jan 1992 ano
10.166
+0.123
1.22%
1 jan 1993 ano
12.211
+2.045
20.12%
1 jan 1994 ano
13.324
+1.114
9.12%
1 jan 1995 ano
13.722
+0.397
2.98%
1 jan 1996 ano
14.694
+0.973
7.09%
1 jan 1997 ano
15.975
+1.28
8.71%
1 jan 1998 ano
16.831
+0.856
5.36%
1 jan 1999 ano
18.603
+1.772
10.53%
1 jan 2000 ano
21.069
+2.466
13.26%
1 jan 2001 ano
21.288
+0.218
1.04%
1 jan 2002 ano
20.774
-0.514
-2.41%
1 jan 2003 ano
20.875
+0.101
0.49%
1 jan 2004 ano
19.932
-0.943
-4.52%
1 jan 2005 ano
21.274
+1.342
6.73%
1 jan 2006 ano
21.712
+0.438
2.06%
1 jan 2007 ano
23.091
+1.38
6.35%
1 jan 2008 ano
24.547
+1.456
6.31%
1 jan 2009 ano
25.236
+0.689
2.81%
1 jan 2010 ano
26.531
+1.295
5.13%
1 jan 2011 ano
27.376
+0.845
3.18%
1 jan 2012 ano
28.572
+1.196
4.37%
1 jan 2013 ano
30.428
+1.856
6.5%
1 jan 2014 ano
31.06
+0.632
2.08%
Classificação de países por estatísticas atuais por anos


Comentários: