29
/pt/
pt
AIzaSyAYiBZKx7MnpbEhh9jyipgxe19OcubqV5w
April 1, 2024
94483
Burkina Faso
BFA
true
2
1
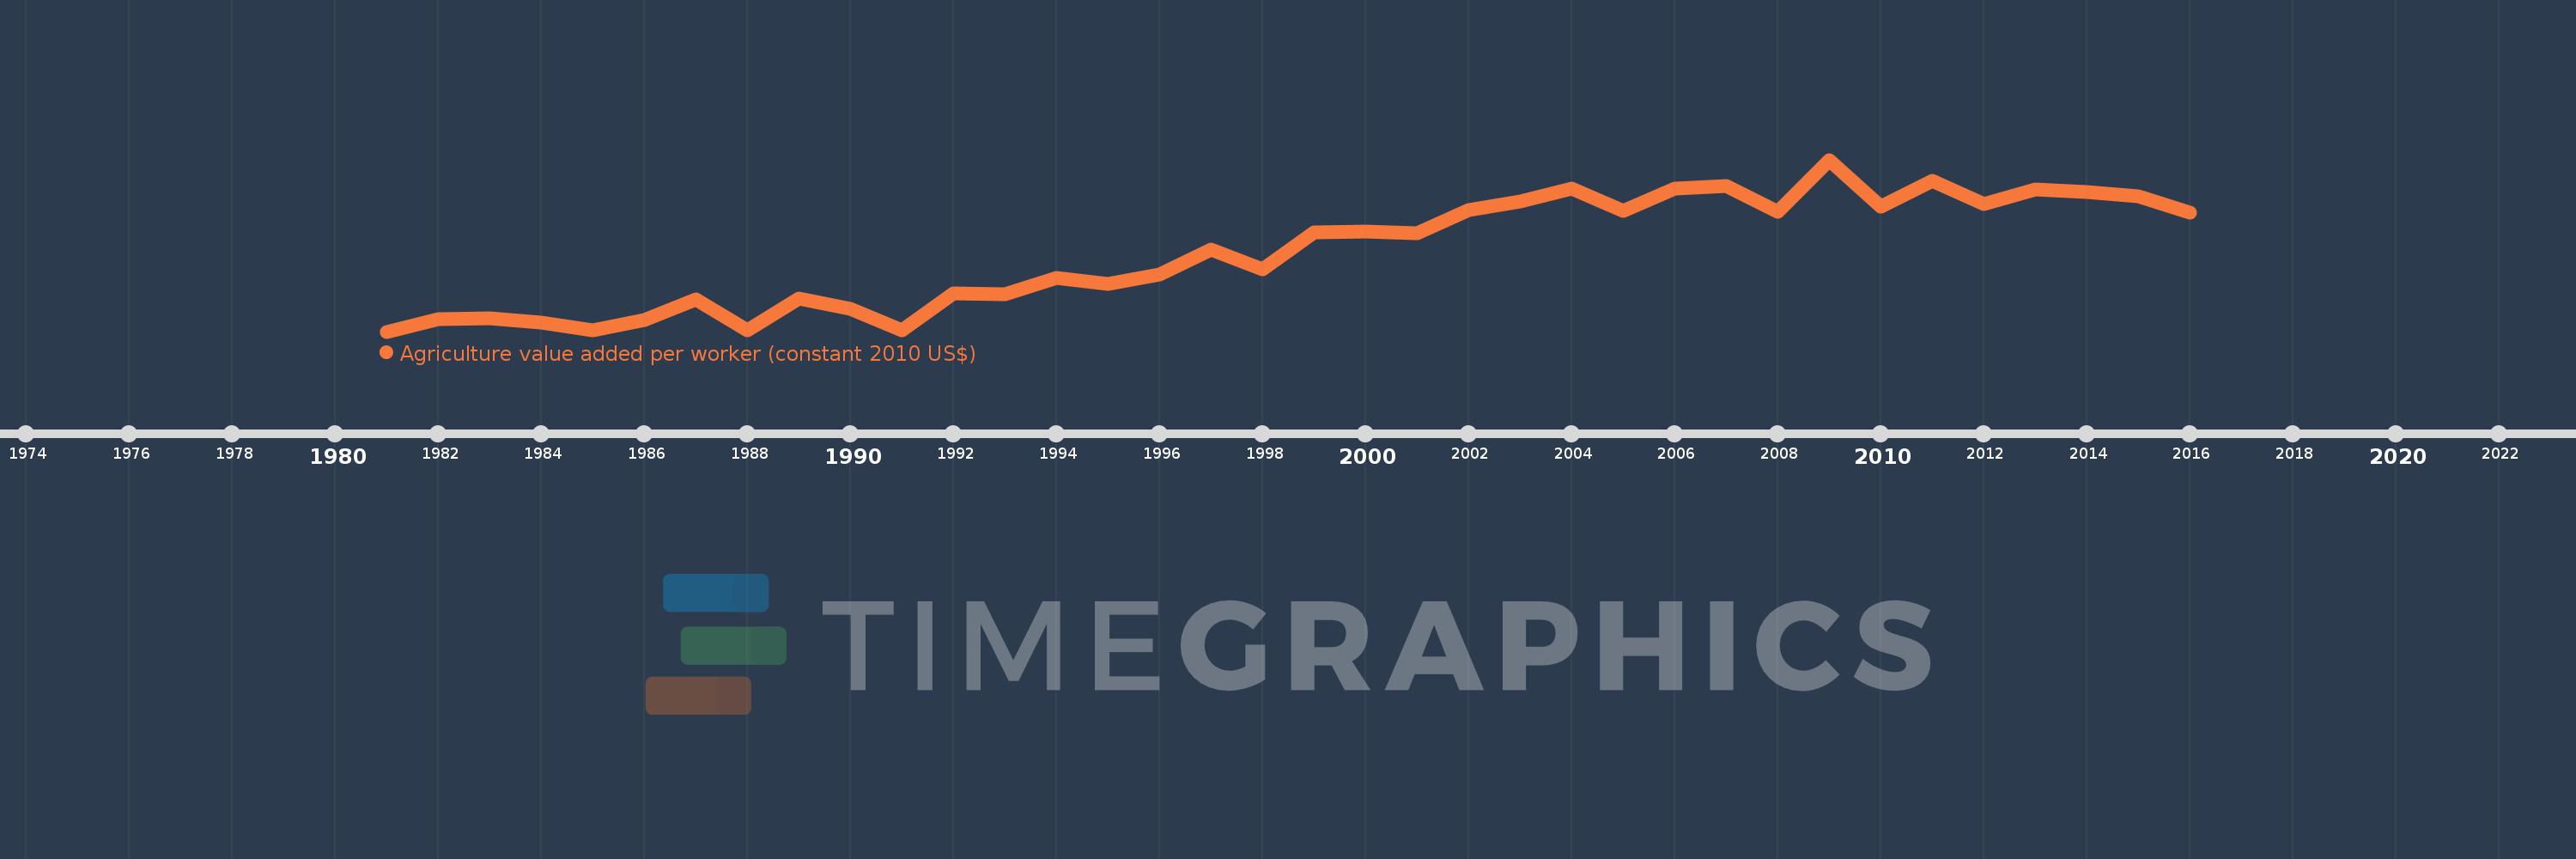
Agriculture value added per worker (constant 2010 US$)
2016,2015,2014,2013,2012,2011,2010,2009,2008,2007,2006,2005,2004,2003,2002,2001,2000,1999,1998,1997,1996,1995,1994,1993,1992,1991,1990,1989,1988,1987,1986,1985,1984,1983,1982,1981
Estas estatísticas em outros países:
AfghanistanAlbaniaAlgeriaAndorraAntigua and BarbudaArab WorldArgentinaArmeniaArubaAustraliaAustriaAzerbaijanBahamas, TheBahrainBangladeshBarbadosBelarusBelgiumBelizeBeninBermudaBhutanBoliviaBosnia and HerzegovinaBotswanaBrazilBrunei DarussalamBulgariaBurkina FasoBurundiCabo VerdeCambodiaCameroonCanadaCaribbean small statesCentral African RepublicCentral Europe and the BalticsChadChileChinaColombiaComorosCongo, Dem. Rep.Congo, Rep.Costa RicaCote d'IvoireCroatiaCubaCyprusCzech RepublicDenmarkDominicaDominican RepublicEarly-demographic dividendEast Asia & PacificEast Asia & Pacific (excluding high income)East Asia & Pacific (IDA & IBRD countries)EcuadorEgypt, Arab Rep.El SalvadorEquatorial GuineaEstoniaEthiopiaEuro areaEurope & Central AsiaEurope & Central Asia (excluding high income)Europe & Central Asia (IDA & IBRD countries)European UnionFijiFinlandFragile and conflict affected situationsFranceGabonGambia, TheGeorgiaGermanyGhanaGreeceGrenadaGuatemalaGuineaGuinea-BissauGuyanaHeavily indebted poor countries (HIPC)High incomeHondurasHungaryIBRD onlyIcelandIDA & IBRD totalIDA blendIDA onlyIDA totalIndiaIndonesiaIran, Islamic Rep.IraqIrelandItalyJamaicaJapanJordanKazakhstanKenyaKiribatiKorea, Rep.KuwaitKyrgyz RepublicLao PDRLate-demographic dividendLatin America & Caribbean Latin America & Caribbean (excluding high income)Latin America & the Caribbean (IDA & IBRD countries)LatviaLeast developed countries: UN classificationLebanonLesothoLiberiaLithuaniaLow & middle incomeLow incomeLower middle incomeLuxembourgMacedonia, FYRMadagascarMalawiMalaysiaMaldivesMaliMaltaMarshall IslandsMauritaniaMauritiusMexicoMicronesia, Fed. Sts.Middle East & North AfricaMiddle East & North Africa (excluding high income)Middle East & North Africa (IDA & IBRD countries)Middle incomeMoldovaMongoliaMontenegroMoroccoMozambiqueMyanmarNamibiaNepalNetherlandsNew ZealandNicaraguaNigerNigeriaNorth AmericaNorwayOECD membersOmanOther small statesPakistanPalauPanamaParaguayPeruPhilippinesPolandPortugalPost-demographic dividendPre-demographic dividendPuerto RicoQatarRomaniaRussian FederationRwandaSamoaSao Tome and PrincipeSaudi ArabiaSenegalSerbiaSeychellesSierra LeoneSingaporeSlovak RepublicSloveniaSmall statesSouth AfricaSouth AsiaSouth Asia (IDA & IBRD)SpainSri LankaSt. Kitts and NevisSt. LuciaSt. Vincent and the GrenadinesSub-Saharan Africa Sub-Saharan Africa (excluding high income)Sub-Saharan Africa (IDA & IBRD countries)SudanSurinameSwazilandSwedenSwitzerlandTajikistanTanzaniaThailandTimor-LesteTogoTongaTrinidad and TobagoTunisiaTurkeyTurkmenistanTuvaluUgandaUkraineUnited Arab EmiratesUnited KingdomUnited StatesUpper middle incomeUruguayUzbekistanVanuatuVenezuela, RBVietnamWest Bank and GazaWorldYemen, Rep.ZambiaZimbabwe Linha do tempo:
Nesta escala de tempo está apresentado um gráfico de 1981 ano até 2016 ano Burkina Faso. Dados de 1980 ano ausente. O número de observações reais por data: 36.
Fonte (nome):
Indicadores de desenvolvimento mundial
Fonte (organização):
Derived from World Bank national accounts files and Food and Agriculture Organization, Production Yearbook and data files.
Categorias:
Agriculture & Rural Development
Foi atualizado:
23 abr 2017 ano
Indicadores de alterações dos valores ao longo dos anos
Mínimo:
247.12
1 jan 1981 ano
Máximo:
447.545
1 jan 2009 ano
Na data de observação
Valor
Mudança absoluta
A alteração em relação ao valor anterior
1 jan 1981 ano
247.12
+247.12
0.0%
1 jan 1982 ano
261.646
+14.527
5.88%
1 jan 1983 ano
263.066
+1.42
0.54%
1 jan 1984 ano
257.853
-5.213
-1.98%
1 jan 1985 ano
249.068
-8.785
-3.41%
1 jan 1986 ano
260.182
+11.114
4.46%
1 jan 1987 ano
285.117
+24.935
9.58%
1 jan 1988 ano
248.922
-36.194
-12.69%
1 jan 1989 ano
285.339
+36.417
14.63%
1 jan 1990 ano
273.391
-11.948
-4.19%
1 jan 1991 ano
248.304
-25.087
-9.18%
1 jan 1992 ano
291.473
+43.169
17.39%
1 jan 1993 ano
290.545
-0.928
-0.32%
1 jan 1994 ano
310.125
+19.58
6.74%
1 jan 1995 ano
303.045
-7.081
-2.28%
1 jan 1996 ano
313.275
+10.231
3.38%
1 jan 1997 ano
342.681
+29.406
9.39%
1 jan 1998 ano
320.142
-22.539
-6.58%
1 jan 1999 ano
362.556
+42.414
13.25%
1 jan 2000 ano
364.066
+1.51
0.42%
1 jan 2001 ano
361.87
-2.196
-0.6%
1 jan 2002 ano
389.327
+27.456
7.59%
1 jan 2003 ano
398.786
+9.459
2.43%
1 jan 2004 ano
414.336
+15.55
3.9%
1 jan 2005 ano
387.43
-26.906
-6.49%
1 jan 2006 ano
414.223
+26.793
6.92%
1 jan 2007 ano
417.145
+2.922
0.71%
1 jan 2008 ano
386.627
-30.518
-7.32%
1 jan 2009 ano
447.545
+60.918
15.76%
1 jan 2010 ano
393.132
-54.413
-12.16%
1 jan 2011 ano
423.349
+30.217
7.69%
1 jan 2012 ano
395.561
-27.788
-6.56%
1 jan 2013 ano
412.685
+17.124
4.33%
1 jan 2014 ano
410.327
-2.359
-0.57%
1 jan 2015 ano
404.79
-5.536
-1.35%
1 jan 2016 ano
386.238
-18.552
-4.58%
Classificação de países por estatísticas atuais por anos


Comentários: