29
/pt/
pt
AIzaSyAYiBZKx7MnpbEhh9jyipgxe19OcubqV5w
April 1, 2024
89471
Botswana
BWA
true
2
1
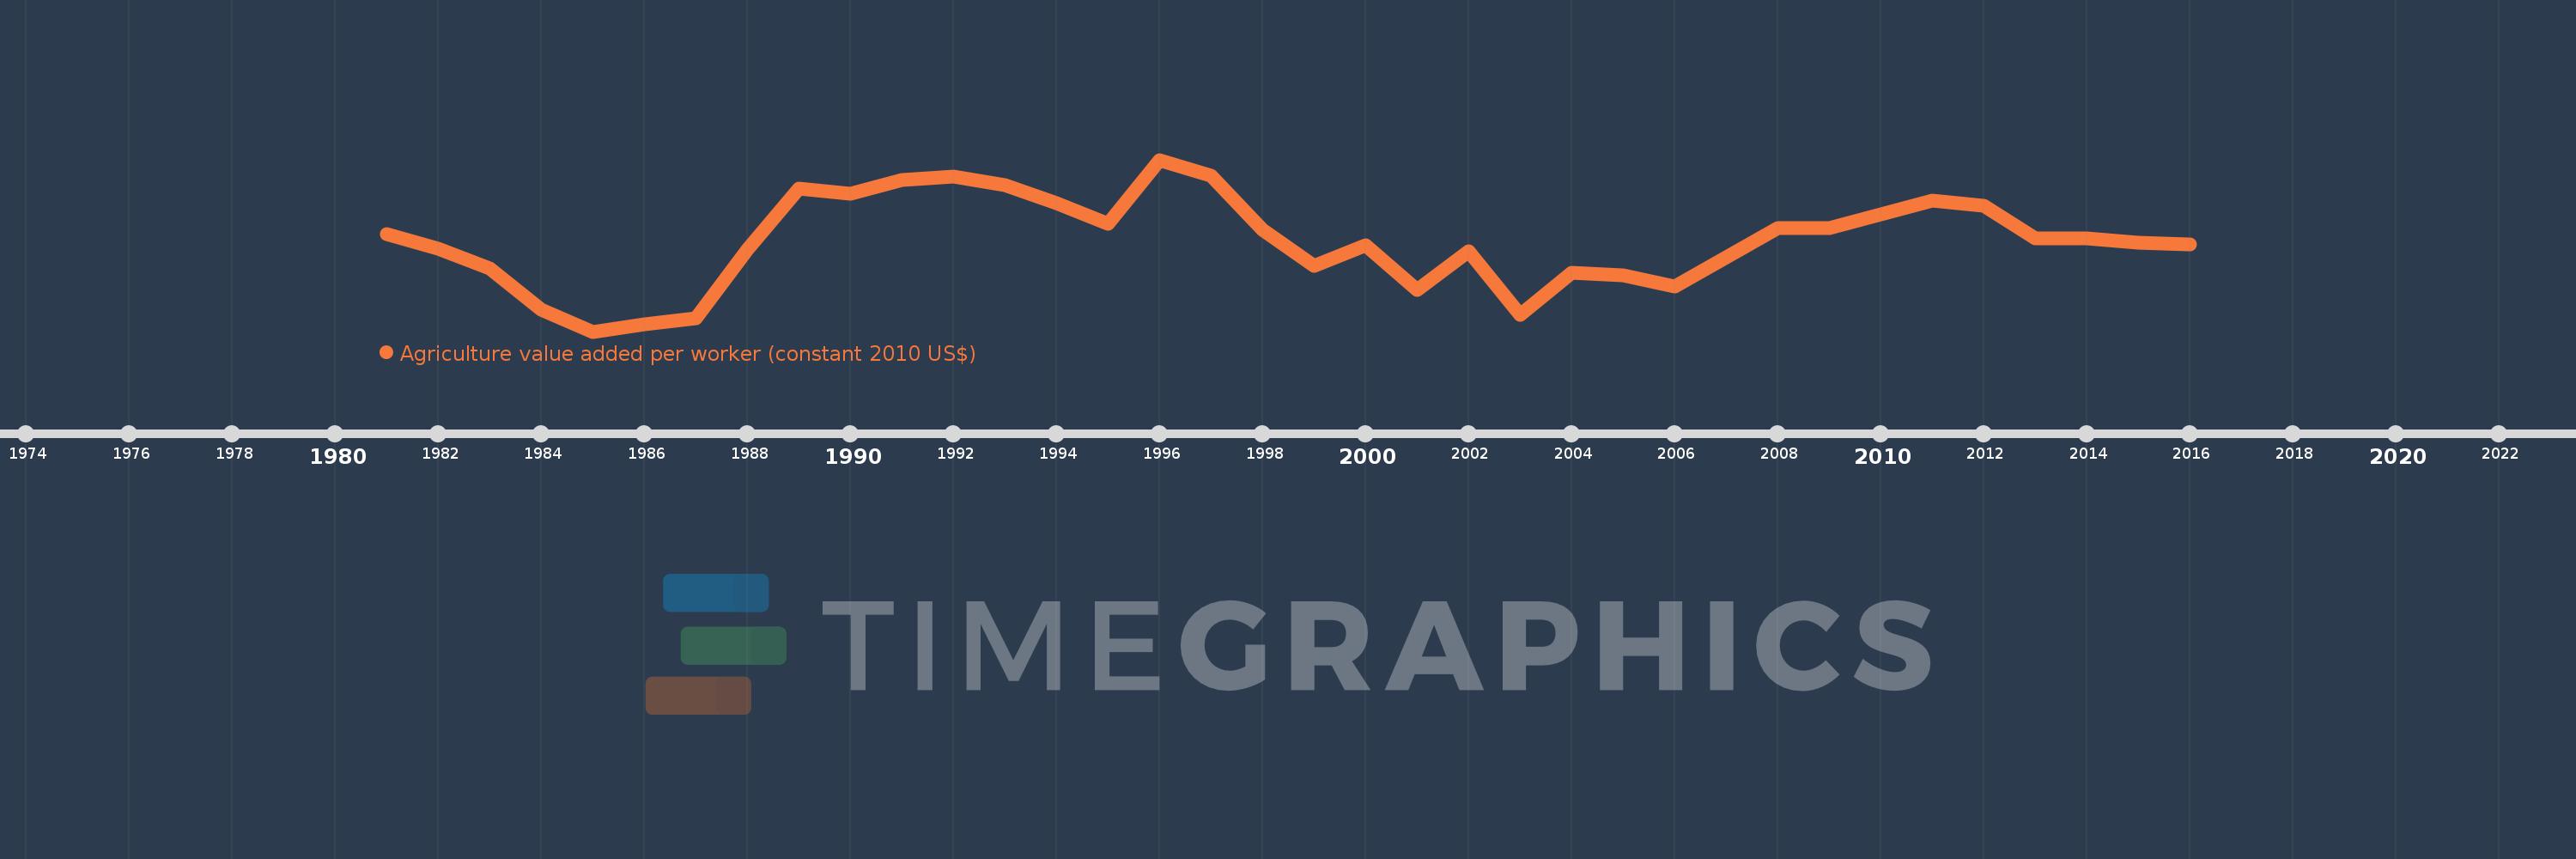
Agriculture value added per worker (constant 2010 US$)
2016,2015,2014,2013,2012,2011,2010,2009,2008,2007,2006,2005,2004,2003,2002,2001,2000,1999,1998,1997,1996,1995,1994,1993,1992,1991,1990,1989,1988,1987,1986,1985,1984,1983,1982,1981
Estas estatísticas em outros países:
AfghanistanAlbaniaAlgeriaAndorraAntigua and BarbudaArab WorldArgentinaArmeniaArubaAustraliaAustriaAzerbaijanBahamas, TheBahrainBangladeshBarbadosBelarusBelgiumBelizeBeninBermudaBhutanBoliviaBosnia and HerzegovinaBotswanaBrazilBrunei DarussalamBulgariaBurkina FasoBurundiCabo VerdeCambodiaCameroonCanadaCaribbean small statesCentral African RepublicCentral Europe and the BalticsChadChileChinaColombiaComorosCongo, Dem. Rep.Congo, Rep.Costa RicaCote d'IvoireCroatiaCubaCyprusCzech RepublicDenmarkDominicaDominican RepublicEarly-demographic dividendEast Asia & PacificEast Asia & Pacific (excluding high income)East Asia & Pacific (IDA & IBRD countries)EcuadorEgypt, Arab Rep.El SalvadorEquatorial GuineaEstoniaEthiopiaEuro areaEurope & Central AsiaEurope & Central Asia (excluding high income)Europe & Central Asia (IDA & IBRD countries)European UnionFijiFinlandFragile and conflict affected situationsFranceGabonGambia, TheGeorgiaGermanyGhanaGreeceGrenadaGuatemalaGuineaGuinea-BissauGuyanaHeavily indebted poor countries (HIPC)High incomeHondurasHungaryIBRD onlyIcelandIDA & IBRD totalIDA blendIDA onlyIDA totalIndiaIndonesiaIran, Islamic Rep.IraqIrelandItalyJamaicaJapanJordanKazakhstanKenyaKiribatiKorea, Rep.KuwaitKyrgyz RepublicLao PDRLate-demographic dividendLatin America & Caribbean Latin America & Caribbean (excluding high income)Latin America & the Caribbean (IDA & IBRD countries)LatviaLeast developed countries: UN classificationLebanonLesothoLiberiaLithuaniaLow & middle incomeLow incomeLower middle incomeLuxembourgMacedonia, FYRMadagascarMalawiMalaysiaMaldivesMaliMaltaMarshall IslandsMauritaniaMauritiusMexicoMicronesia, Fed. Sts.Middle East & North AfricaMiddle East & North Africa (excluding high income)Middle East & North Africa (IDA & IBRD countries)Middle incomeMoldovaMongoliaMontenegroMoroccoMozambiqueMyanmarNamibiaNepalNetherlandsNew ZealandNicaraguaNigerNigeriaNorth AmericaNorwayOECD membersOmanOther small statesPakistanPalauPanamaParaguayPeruPhilippinesPolandPortugalPost-demographic dividendPre-demographic dividendPuerto RicoQatarRomaniaRussian FederationRwandaSamoaSao Tome and PrincipeSaudi ArabiaSenegalSerbiaSeychellesSierra LeoneSingaporeSlovak RepublicSloveniaSmall statesSouth AfricaSouth AsiaSouth Asia (IDA & IBRD)SpainSri LankaSt. Kitts and NevisSt. LuciaSt. Vincent and the GrenadinesSub-Saharan Africa Sub-Saharan Africa (excluding high income)Sub-Saharan Africa (IDA & IBRD countries)SudanSurinameSwazilandSwedenSwitzerlandTajikistanTanzaniaThailandTimor-LesteTogoTongaTrinidad and TobagoTunisiaTurkeyTurkmenistanTuvaluUgandaUkraineUnited Arab EmiratesUnited KingdomUnited StatesUpper middle incomeUruguayUzbekistanVanuatuVenezuela, RBVietnamWest Bank and GazaWorldYemen, Rep.ZambiaZimbabwe Linha do tempo:
Nesta escala de tempo está apresentado um gráfico de 1981 ano até 2016 ano Botswana. Dados de 1980 ano ausente. O número de observações reais por data: 36.
Fonte (nome):
Indicadores de desenvolvimento mundial
Fonte (organização):
Derived from World Bank national accounts files and Food and Agriculture Organization, Production Yearbook and data files.
Categorias:
Agriculture & Rural Development
Foi atualizado:
23 abr 2017 ano
Indicadores de alterações dos valores ao longo dos anos
Mínimo:
623.004
1 jan 1985 ano
Máximo:
1.123 mil
1 jan 1996 ano
Na data de observação
Valor
Mudança absoluta
A alteração em relação ao valor anterior
1 jan 1981 ano
906.848
+906.848
0.0%
1 jan 1982 ano
863.925
-42.923
-4.73%
1 jan 1983 ano
805.473
-58.452
-6.77%
1 jan 1984 ano
687.385
-118.088
-14.66%
1 jan 1985 ano
623.004
-64.381
-9.37%
1 jan 1986 ano
644.804
+21.8
3.5%
1 jan 1987 ano
662.291
+17.488
2.71%
1 jan 1988 ano
860.563
+198.272
29.94%
1 jan 1989 ano
1.039 mil
+178.287
20.72%
1 jan 1990 ano
1.024 mil
-14.749
-1.42%
1 jan 1991 ano
1.065 mil
+41.093
4.01%
1 jan 1992 ano
1.073 mil
+8.274
0.78%
1 jan 1993 ano
1.05 mil
-23.7
-2.21%
1 jan 1994 ano
996.47
-53.298
-5.08%
1 jan 1995 ano
936.58
-59.89
-6.01%
1 jan 1996 ano
1.123 mil
+186.221
19.88%
1 jan 1997 ano
1.077 mil
-45.489
-4.05%
1 jan 1998 ano
920.338
-156.974
-14.57%
1 jan 1999 ano
813.731
-106.606
-11.58%
1 jan 2000 ano
874.212
+60.481
7.43%
1 jan 2001 ano
745.4
-128.812
-14.73%
1 jan 2002 ano
856.226
+110.827
14.87%
1 jan 2003 ano
670.96
-185.267
-21.64%
1 jan 2004 ano
794.476
+123.517
18.41%
1 jan 2005 ano
786.987
-7.489
-0.94%
1 jan 2006 ano
754.014
-32.974
-4.19%
1 jan 2007 ano
839.974
+85.96
11.4%
1 jan 2008 ano
923.89
+83.917
9.99%
1 jan 2009 ano
923.654
-0.237
-0.03%
1 jan 2010 ano
963.618
+39.964
4.33%
1 jan 2011 ano
1.004 mil
+39.968
4.15%
1 jan 2012 ano
989.732
-13.854
-1.38%
1 jan 2013 ano
894.18
-95.551
-9.65%
1 jan 2014 ano
895.122
+0.941
0.11%
1 jan 2015 ano
881.263
-13.859
-1.55%
1 jan 2016 ano
876.208
-5.054
-0.57%
Classificação de países por estatísticas atuais por anos


Comentários: