29
/pt/
pt
AIzaSyAYiBZKx7MnpbEhh9jyipgxe19OcubqV5w
April 1, 2024
27855
East Asia & Pacific (excluding high income)
EAP
false
2
1
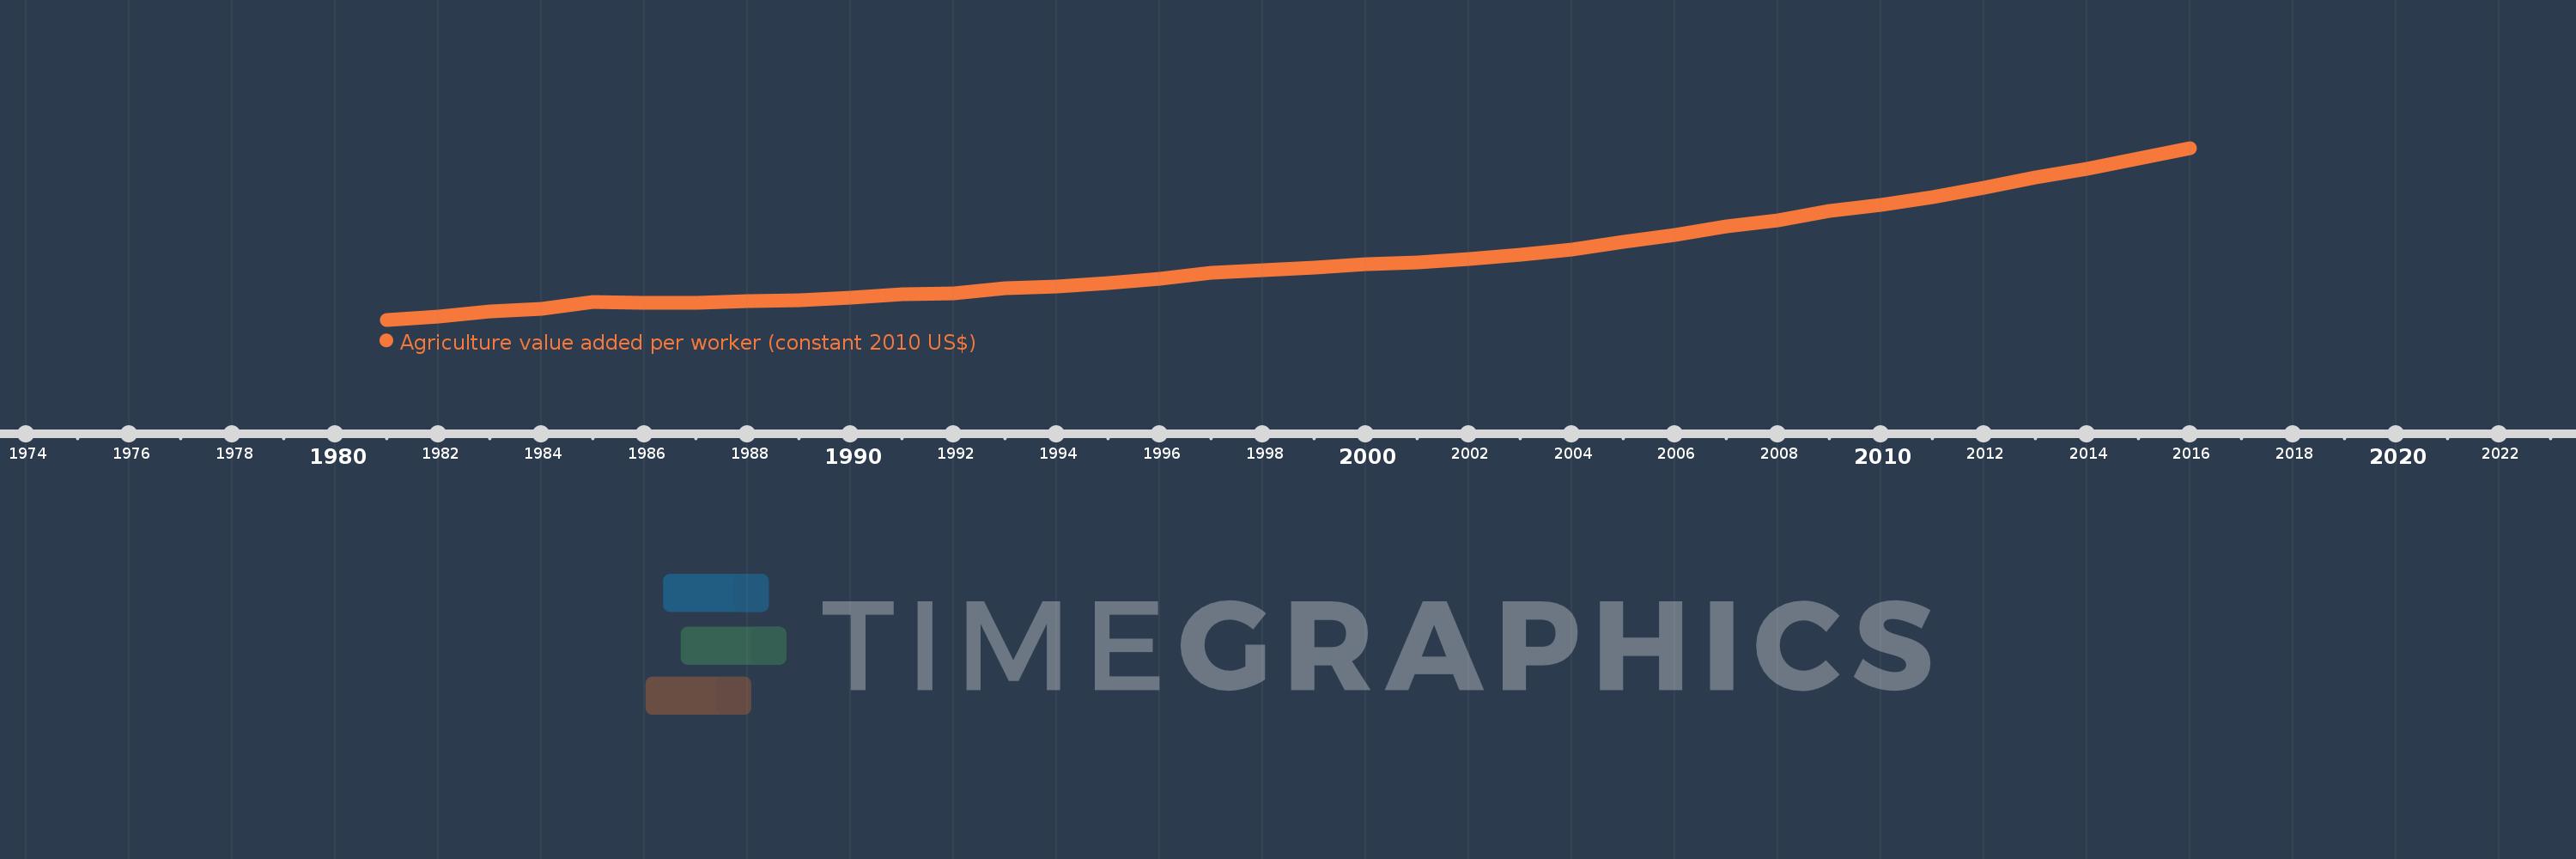
Agriculture value added per worker (constant 2010 US$)
2016,2015,2014,2013,2012,2011,2010,2009,2008,2007,2006,2005,2004,2003,2002,2001,2000,1999,1998,1997,1996,1995,1994,1993,1992,1991,1990,1989,1988,1987,1986,1985,1984,1983,1982,1981
Estas estatísticas em outros países:
AfghanistanAlbaniaAlgeriaAndorraAntigua and BarbudaArab WorldArgentinaArmeniaArubaAustraliaAustriaAzerbaijanBahamas, TheBahrainBangladeshBarbadosBelarusBelgiumBelizeBeninBermudaBhutanBoliviaBosnia and HerzegovinaBotswanaBrazilBrunei DarussalamBulgariaBurkina FasoBurundiCabo VerdeCambodiaCameroonCanadaCaribbean small statesCentral African RepublicCentral Europe and the BalticsChadChileChinaColombiaComorosCongo, Dem. Rep.Congo, Rep.Costa RicaCote d'IvoireCroatiaCubaCyprusCzech RepublicDenmarkDominicaDominican RepublicEarly-demographic dividendEast Asia & PacificEast Asia & Pacific (excluding high income)East Asia & Pacific (IDA & IBRD countries)EcuadorEgypt, Arab Rep.El SalvadorEquatorial GuineaEstoniaEthiopiaEuro areaEurope & Central AsiaEurope & Central Asia (excluding high income)Europe & Central Asia (IDA & IBRD countries)European UnionFijiFinlandFragile and conflict affected situationsFranceGabonGambia, TheGeorgiaGermanyGhanaGreeceGrenadaGuatemalaGuineaGuinea-BissauGuyanaHeavily indebted poor countries (HIPC)High incomeHondurasHungaryIBRD onlyIcelandIDA & IBRD totalIDA blendIDA onlyIDA totalIndiaIndonesiaIran, Islamic Rep.IraqIrelandItalyJamaicaJapanJordanKazakhstanKenyaKiribatiKorea, Rep.KuwaitKyrgyz RepublicLao PDRLate-demographic dividendLatin America & Caribbean Latin America & Caribbean (excluding high income)Latin America & the Caribbean (IDA & IBRD countries)LatviaLeast developed countries: UN classificationLebanonLesothoLiberiaLithuaniaLow & middle incomeLow incomeLower middle incomeLuxembourgMacedonia, FYRMadagascarMalawiMalaysiaMaldivesMaliMaltaMarshall IslandsMauritaniaMauritiusMexicoMicronesia, Fed. Sts.Middle East & North AfricaMiddle East & North Africa (excluding high income)Middle East & North Africa (IDA & IBRD countries)Middle incomeMoldovaMongoliaMontenegroMoroccoMozambiqueMyanmarNamibiaNepalNetherlandsNew ZealandNicaraguaNigerNigeriaNorth AmericaNorwayOECD membersOmanOther small statesPakistanPalauPanamaParaguayPeruPhilippinesPolandPortugalPost-demographic dividendPre-demographic dividendPuerto RicoQatarRomaniaRussian FederationRwandaSamoaSao Tome and PrincipeSaudi ArabiaSenegalSerbiaSeychellesSierra LeoneSingaporeSlovak RepublicSloveniaSmall statesSouth AfricaSouth AsiaSouth Asia (IDA & IBRD)SpainSri LankaSt. Kitts and NevisSt. LuciaSt. Vincent and the GrenadinesSub-Saharan Africa Sub-Saharan Africa (excluding high income)Sub-Saharan Africa (IDA & IBRD countries)SudanSurinameSwazilandSwedenSwitzerlandTajikistanTanzaniaThailandTimor-LesteTogoTongaTrinidad and TobagoTunisiaTurkeyTurkmenistanTuvaluUgandaUkraineUnited Arab EmiratesUnited KingdomUnited StatesUpper middle incomeUruguayUzbekistanVanuatuVenezuela, RBVietnamWest Bank and GazaWorldYemen, Rep.ZambiaZimbabwe Linha do tempo:
Nesta escala de tempo está apresentado um gráfico de 1981 ano até 2016 ano East Asia & Pacific (excluding high income). Dados de 1980 ano ausente. O número de observações reais por data: 36.
Fonte (nome):
Indicadores de desenvolvimento mundial
Fonte (organização):
Derived from World Bank national accounts files and Food and Agriculture Organization, Production Yearbook and data files.
Categorias:
Agriculture & Rural Development
Foi atualizado:
23 abr 2017 ano
Indicadores de alterações dos valores ao longo dos anos
Mínimo:
530.987
1 jan 1981 ano
Máximo:
1.578 mil
1 jan 2016 ano
Na data de observação
Valor
Mudança absoluta
A alteração em relação ao valor anterior
1 jan 1981 ano
530.987
+530.987
0.0%
1 jan 1982 ano
551.496
+20.508
3.86%
1 jan 1983 ano
581.71
+30.215
5.48%
1 jan 1984 ano
599.61
+17.9
3.08%
1 jan 1985 ano
641.904
+42.294
7.05%
1 jan 1986 ano
632.157
-9.748
-1.52%
1 jan 1987 ano
632.814
+0.658
0.1%
1 jan 1988 ano
641.947
+9.132
1.44%
1 jan 1989 ano
649.154
+7.208
1.12%
1 jan 1990 ano
664.921
+15.767
2.43%
1 jan 1991 ano
686.362
+21.441
3.22%
1 jan 1992 ano
694.282
+7.92
1.15%
1 jan 1993 ano
722.403
+28.121
4.05%
1 jan 1994 ano
735.992
+13.589
1.88%
1 jan 1995 ano
756.645
+20.654
2.81%
1 jan 1996 ano
783.09
+26.444
3.49%
1 jan 1997 ano
814.977
+31.887
4.07%
1 jan 1998 ano
834.848
+19.871
2.44%
1 jan 1999 ano
850.099
+15.252
1.83%
1 jan 2000 ano
870.626
+20.526
2.41%
1 jan 2001 ano
882.354
+11.729
1.35%
1 jan 2002 ano
903.298
+20.944
2.37%
1 jan 2003 ano
926.442
+23.144
2.56%
1 jan 2004 ano
956.863
+30.421
3.28%
1 jan 2005 ano
1.006 mil
+48.638
5.08%
1 jan 2006 ano
1.05 mil
+44.515
4.43%
1 jan 2007 ano
1.099 mil
+49.137
4.68%
1 jan 2008 ano
1.138 mil
+39.038
3.55%
1 jan 2009 ano
1.192 mil
+53.443
4.7%
1 jan 2010 ano
1.231 mil
+38.898
3.26%
1 jan 2011 ano
1.279 mil
+48.051
3.9%
1 jan 2012 ano
1.335 mil
+56.724
4.44%
1 jan 2013 ano
1.396 mil
+60.638
4.54%
1 jan 2014 ano
1.453 mil
+56.559
4.05%
1 jan 2015 ano
1.516 mil
+63.281
4.36%
1 jan 2016 ano
1.578 mil
+61.965
4.09%
Classificação de países por estatísticas atuais por anos


Comentários: