29
/pt/
pt
AIzaSyAYiBZKx7MnpbEhh9jyipgxe19OcubqV5w
April 1, 2024
235347
Senegal
SEN
true
2
1
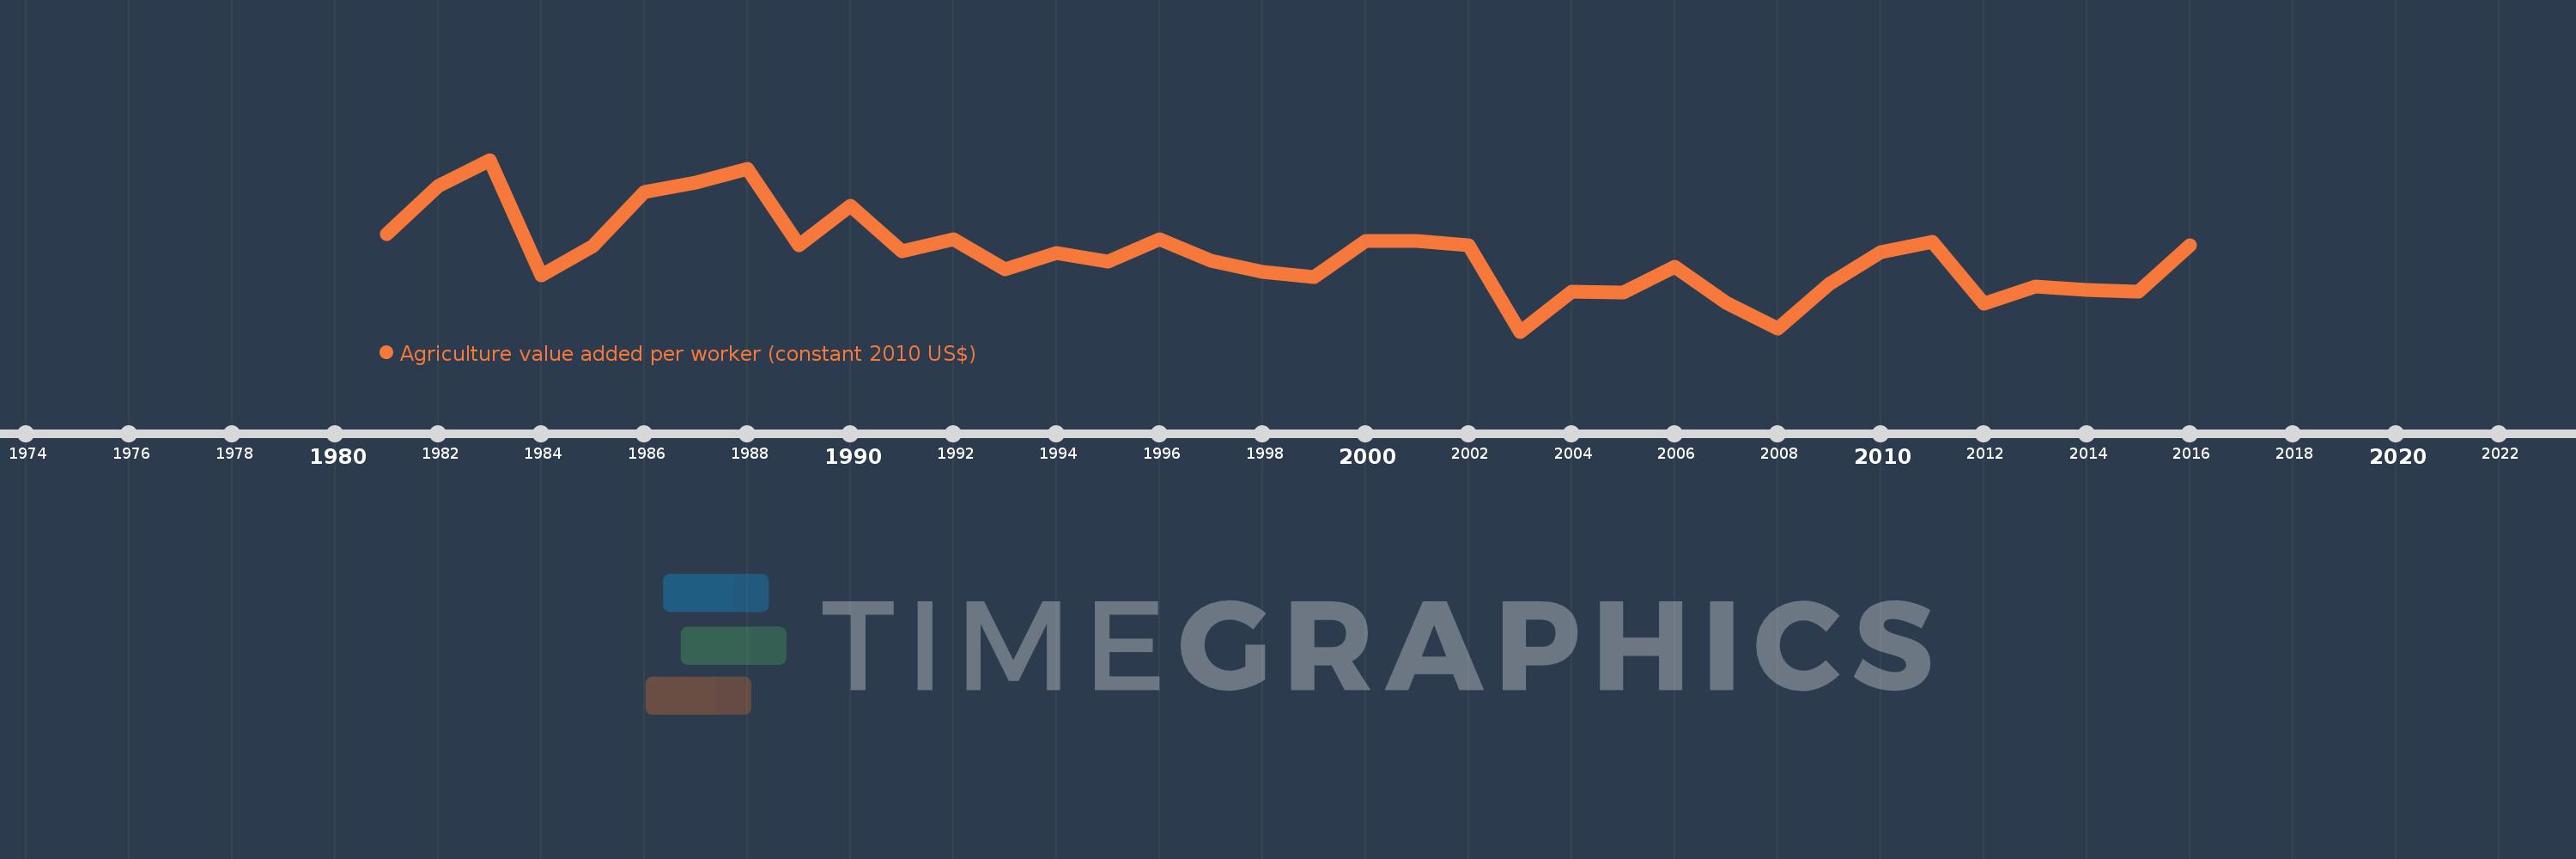
Agriculture value added per worker (constant 2010 US$)
2016,2015,2014,2013,2012,2011,2010,2009,2008,2007,2006,2005,2004,2003,2002,2001,2000,1999,1998,1997,1996,1995,1994,1993,1992,1991,1990,1989,1988,1987,1986,1985,1984,1983,1982,1981
Estas estatísticas em outros países:
AfghanistanAlbaniaAlgeriaAndorraAntigua and BarbudaArab WorldArgentinaArmeniaArubaAustraliaAustriaAzerbaijanBahamas, TheBahrainBangladeshBarbadosBelarusBelgiumBelizeBeninBermudaBhutanBoliviaBosnia and HerzegovinaBotswanaBrazilBrunei DarussalamBulgariaBurkina FasoBurundiCabo VerdeCambodiaCameroonCanadaCaribbean small statesCentral African RepublicCentral Europe and the BalticsChadChileChinaColombiaComorosCongo, Dem. Rep.Congo, Rep.Costa RicaCote d'IvoireCroatiaCubaCyprusCzech RepublicDenmarkDominicaDominican RepublicEarly-demographic dividendEast Asia & PacificEast Asia & Pacific (excluding high income)East Asia & Pacific (IDA & IBRD countries)EcuadorEgypt, Arab Rep.El SalvadorEquatorial GuineaEstoniaEthiopiaEuro areaEurope & Central AsiaEurope & Central Asia (excluding high income)Europe & Central Asia (IDA & IBRD countries)European UnionFijiFinlandFragile and conflict affected situationsFranceGabonGambia, TheGeorgiaGermanyGhanaGreeceGrenadaGuatemalaGuineaGuinea-BissauGuyanaHeavily indebted poor countries (HIPC)High incomeHondurasHungaryIBRD onlyIcelandIDA & IBRD totalIDA blendIDA onlyIDA totalIndiaIndonesiaIran, Islamic Rep.IraqIrelandItalyJamaicaJapanJordanKazakhstanKenyaKiribatiKorea, Rep.KuwaitKyrgyz RepublicLao PDRLate-demographic dividendLatin America & Caribbean Latin America & Caribbean (excluding high income)Latin America & the Caribbean (IDA & IBRD countries)LatviaLeast developed countries: UN classificationLebanonLesothoLiberiaLithuaniaLow & middle incomeLow incomeLower middle incomeLuxembourgMacedonia, FYRMadagascarMalawiMalaysiaMaldivesMaliMaltaMarshall IslandsMauritaniaMauritiusMexicoMicronesia, Fed. Sts.Middle East & North AfricaMiddle East & North Africa (excluding high income)Middle East & North Africa (IDA & IBRD countries)Middle incomeMoldovaMongoliaMontenegroMoroccoMozambiqueMyanmarNamibiaNepalNetherlandsNew ZealandNicaraguaNigerNigeriaNorth AmericaNorwayOECD membersOmanOther small statesPakistanPalauPanamaParaguayPeruPhilippinesPolandPortugalPost-demographic dividendPre-demographic dividendPuerto RicoQatarRomaniaRussian FederationRwandaSamoaSao Tome and PrincipeSaudi ArabiaSenegalSerbiaSeychellesSierra LeoneSingaporeSlovak RepublicSloveniaSmall statesSouth AfricaSouth AsiaSouth Asia (IDA & IBRD)SpainSri LankaSt. Kitts and NevisSt. LuciaSt. Vincent and the GrenadinesSub-Saharan Africa Sub-Saharan Africa (excluding high income)Sub-Saharan Africa (IDA & IBRD countries)SudanSurinameSwazilandSwedenSwitzerlandTajikistanTanzaniaThailandTimor-LesteTogoTongaTrinidad and TobagoTunisiaTurkeyTurkmenistanTuvaluUgandaUkraineUnited Arab EmiratesUnited KingdomUnited StatesUpper middle incomeUruguayUzbekistanVanuatuVenezuela, RBVietnamWest Bank and GazaWorldYemen, Rep.ZambiaZimbabwe Linha do tempo:
Nesta escala de tempo está apresentado um gráfico de 1981 ano até 2016 ano Senegal. Dados de 1980 ano ausente. O número de observações reais por data: 36.
Fonte (nome):
Indicadores de desenvolvimento mundial
Fonte (organização):
Derived from World Bank national accounts files and Food and Agriculture Organization, Production Yearbook and data files.
Categorias:
Agriculture & Rural Development
Foi atualizado:
23 abr 2017 ano
Indicadores de alterações dos valores ao longo dos anos
Mínimo:
388.515
1 jan 2003 ano
Máximo:
634.977
1 jan 1983 ano
Na data de observação
Valor
Mudança absoluta
A alteração em relação ao valor anterior
1 jan 1981 ano
528.684
+528.684
0.0%
1 jan 1982 ano
597.342
+68.658
12.99%
1 jan 1983 ano
634.977
+37.635
6.3%
1 jan 1984 ano
469.205
-165.773
-26.11%
1 jan 1985 ano
511.304
+42.099
8.97%
1 jan 1986 ano
588.251
+76.947
15.05%
1 jan 1987 ano
602.531
+14.28
2.43%
1 jan 1988 ano
621.428
+18.897
3.14%
1 jan 1989 ano
512.437
-108.991
-17.54%
1 jan 1990 ano
569.616
+57.179
11.16%
1 jan 1991 ano
503.269
-66.346
-11.65%
1 jan 1992 ano
520.63
+17.361
3.45%
1 jan 1993 ano
477.339
-43.292
-8.32%
1 jan 1994 ano
501.777
+24.439
5.12%
1 jan 1995 ano
488.636
-13.141
-2.62%
1 jan 1996 ano
521.251
+32.614
6.67%
1 jan 1997 ano
490.384
-30.867
-5.92%
1 jan 1998 ano
474.605
-15.778
-3.22%
1 jan 1999 ano
467.327
-7.278
-1.53%
1 jan 2000 ano
518.733
+51.406
11.0%
1 jan 2001 ano
518.497
-0.236
-0.05%
1 jan 2002 ano
512.334
-6.163
-1.19%
1 jan 2003 ano
388.515
-123.819
-24.17%
1 jan 2004 ano
446.033
+57.518
14.8%
1 jan 2005 ano
444.839
-1.194
-0.27%
1 jan 2006 ano
481.241
+36.402
8.18%
1 jan 2007 ano
429.745
-51.495
-10.7%
1 jan 2008 ano
393.421
-36.324
-8.45%
1 jan 2009 ano
457.369
+63.947
16.25%
1 jan 2010 ano
502.768
+45.399
9.93%
1 jan 2011 ano
517.25
+14.482
2.88%
1 jan 2012 ano
428.424
-88.827
-17.17%
1 jan 2013 ano
453.357
+24.934
5.82%
1 jan 2014 ano
448.653
-4.705
-1.04%
1 jan 2015 ano
446.33
-2.322
-0.52%
1 jan 2016 ano
512.575
+66.245
14.84%
Classificação de países por estatísticas atuais por anos


Comentários: