29
/pt/
pt
AIzaSyAYiBZKx7MnpbEhh9jyipgxe19OcubqV5w
April 1, 2024
94016
Bulgaria
BGR
true
2
1
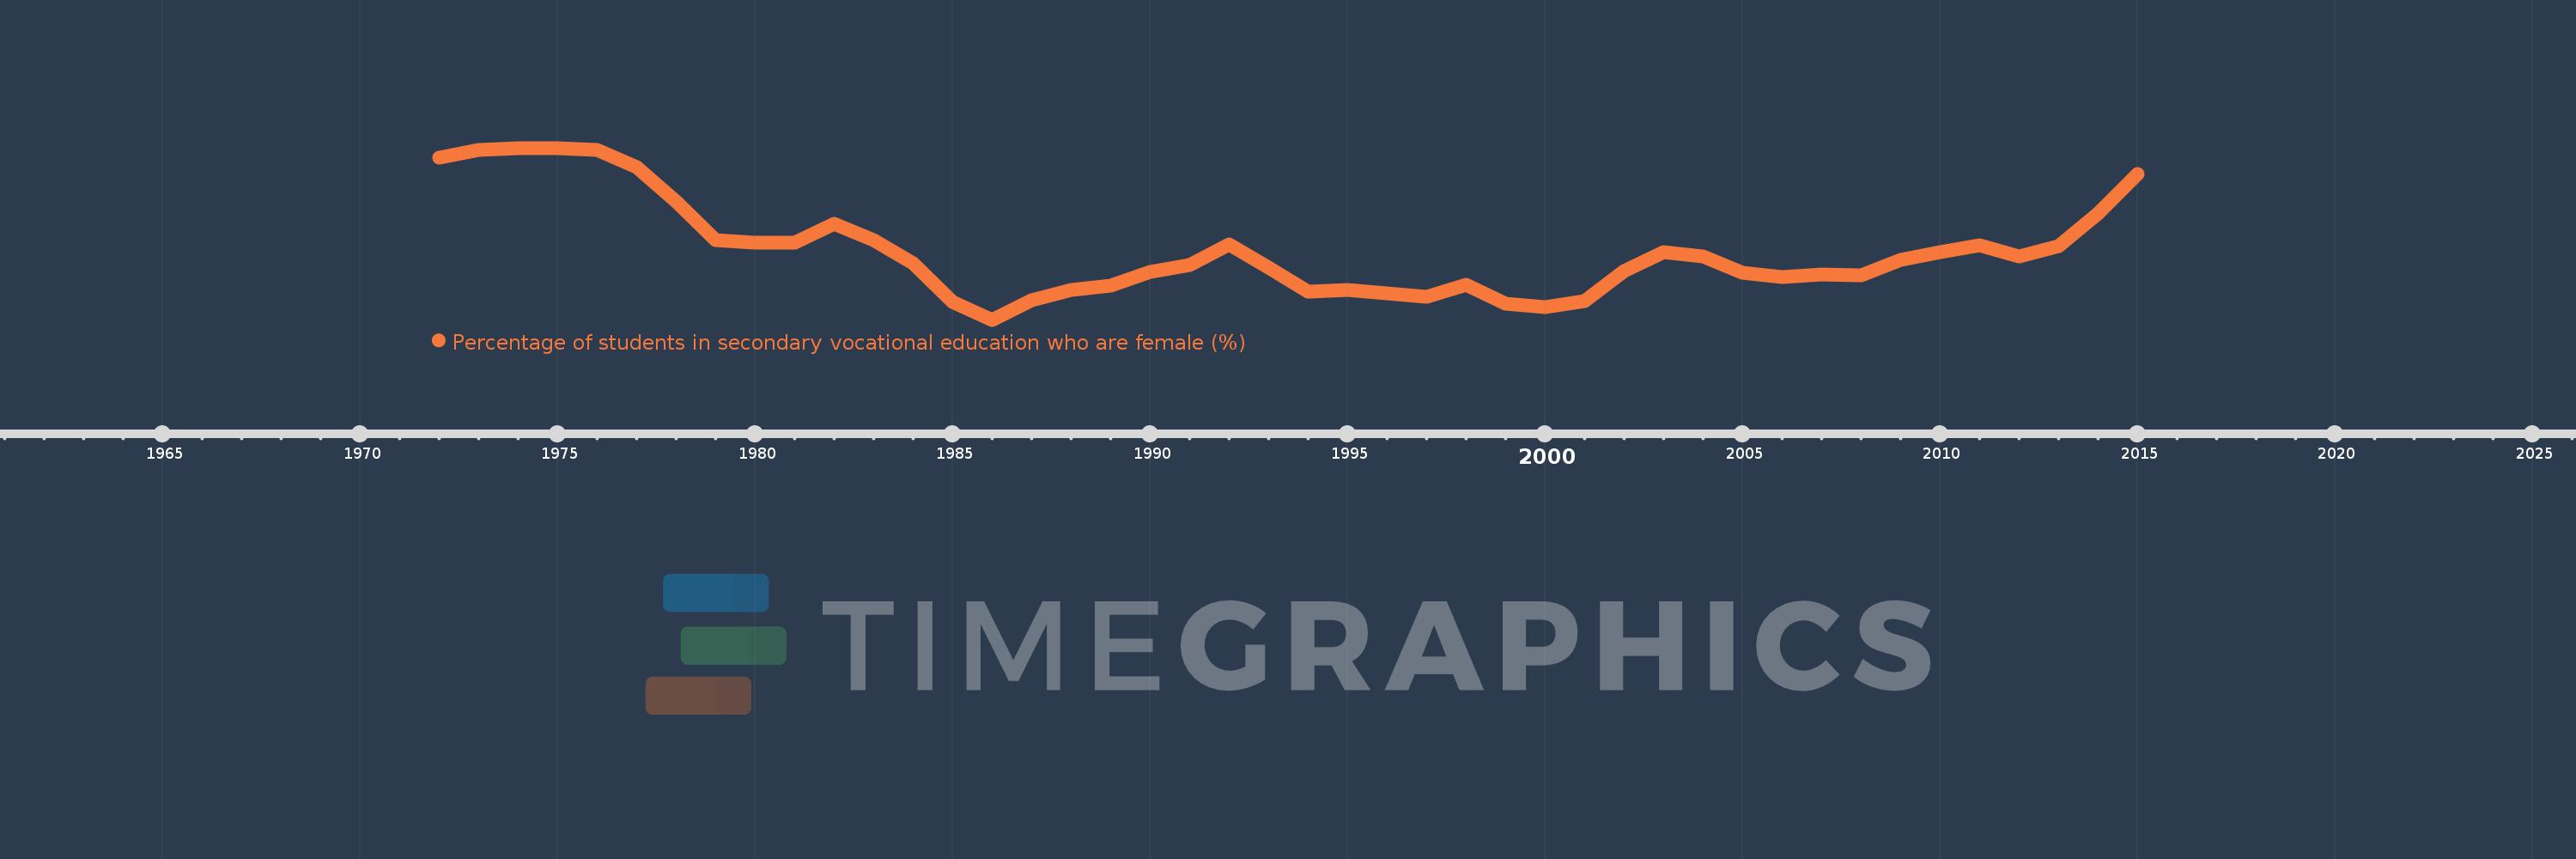
Percentage of students in secondary vocational education who are female (%)
2015,2014,2013,2012,2011,2010,2009,2008,2007,2006,2005,2004,2003,2002,2001,2000,1999,1998,1997,1996,1995,1994,1993,1992,1991,1990,1989,1988,1987,1986,1985,1984,1983,1982,1981,1980,1979,1978,1977,1976,1975,1974,1973,1972
Estas estatísticas em outros países:
AfghanistanAlbaniaAlgeriaAndorraAngolaAntigua and BarbudaArab WorldArgentinaArmeniaArubaAustraliaAustriaAzerbaijanBahrainBangladeshBarbadosBelarusBelgiumBelizeBeninBermudaBhutanBoliviaBosnia and HerzegovinaBotswanaBrazilBritish Virgin IslandsBrunei DarussalamBulgariaBurkina FasoBurundiCabo VerdeCambodiaCameroonCanadaCaribbean small statesCentral African RepublicCentral Europe and the BalticsChadChileChinaColombiaComorosCongo, Dem. Rep.Congo, Rep.Costa RicaCote d'IvoireCroatiaCubaCuracaoCyprusCzech RepublicDenmarkDjiboutiDominicaDominican RepublicEarly-demographic dividendEast Asia & PacificEast Asia & Pacific (excluding high income)East Asia & Pacific (IDA & IBRD countries)EcuadorEgypt, Arab Rep.El SalvadorEquatorial GuineaEritreaEstoniaEthiopiaEuro areaEurope & Central AsiaEurope & Central Asia (excluding high income)Europe & Central Asia (IDA & IBRD countries)European UnionFijiFinlandFragile and conflict affected situationsFranceGabonGambia, TheGeorgiaGermanyGhanaGibraltarGreeceGrenadaGuatemalaGuineaGuinea-BissauGuyanaHaitiHeavily indebted poor countries (HIPC)High incomeHondurasHong Kong SAR, ChinaHungaryIBRD onlyIcelandIDA & IBRD totalIDA blendIDA onlyIDA totalIndiaIndonesiaIran, Islamic Rep.IraqIrelandIsraelItalyJamaicaJapanJordanKazakhstanKenyaKiribatiKorea, Rep.KuwaitKyrgyz RepublicLao PDRLate-demographic dividendLatin America & Caribbean Latin America & Caribbean (excluding high income)Latin America & the Caribbean (IDA & IBRD countries)LatviaLeast developed countries: UN classificationLebanonLesothoLiberiaLibyaLiechtensteinLithuaniaLow & middle incomeLow incomeLower middle incomeLuxembourgMacao SAR, ChinaMacedonia, FYRMadagascarMalawiMalaysiaMaldivesMaliMaltaMarshall IslandsMauritaniaMauritiusMexicoMicronesia, Fed. Sts.Middle East & North AfricaMiddle East & North Africa (excluding high income)Middle East & North Africa (IDA & IBRD countries)Middle incomeMoldovaMonacoMongoliaMontenegroMoroccoMozambiqueMyanmarNamibiaNauruNepalNetherlandsNew ZealandNicaraguaNigerNigeriaNorth AmericaNorwayOECD membersOmanOther small statesPacific island small statesPakistanPanamaPapua New GuineaParaguayPeruPolandPortugalPost-demographic dividendPre-demographic dividendPuerto RicoQatarRomaniaRussian FederationRwandaSamoaSan MarinoSao Tome and PrincipeSaudi ArabiaSenegalSerbiaSeychellesSierra LeoneSingaporeSint Maarten (Dutch part)Slovak RepublicSloveniaSmall statesSolomon IslandsSomaliaSouth AfricaSouth AsiaSouth Asia (IDA & IBRD)SpainSri LankaSt. Kitts and NevisSt. LuciaSt. Vincent and the GrenadinesSub-Saharan Africa Sub-Saharan Africa (excluding high income)Sub-Saharan Africa (IDA & IBRD countries)SudanSurinameSwazilandSwedenSwitzerlandSyrian Arab RepublicTajikistanTanzaniaThailandTimor-LesteTogoTongaTrinidad and TobagoTunisiaTurkeyTurkmenistanTurks and Caicos IslandsTuvaluUgandaUkraineUnited Arab EmiratesUnited KingdomUpper middle incomeUruguayUzbekistanVanuatuVenezuela, RBVietnamWest Bank and GazaWorldYemen, Rep.ZambiaZimbabwe Linha do tempo:
Nesta escala de tempo está apresentado um gráfico de 1972 ano até 2015 ano Bulgaria. Dados de 1971 ano ausente. O número de observações reais por data: 44.
Fonte (nome):
Indicadores de desenvolvimento mundial
Fonte (organização):
UNESCO Institute for Statistics
Categorias:
Education, Gender
Foi atualizado:
23 abr 2017 ano
Indicadores de alterações dos valores ao longo dos anos
Mínimo:
36.667
1 jan 1986 ano
Máximo:
42.389
1 jan 1975 ano
Na data de observação
Valor
Mudança absoluta
A alteração em relação ao valor anterior
1 jan 1972 ano
42.075
+42.075
0.0%
1 jan 1973 ano
42.322
+0.247
0.59%
1 jan 1974 ano
42.382
+0.06
0.14%
1 jan 1975 ano
42.389
+0.007
0.02%
1 jan 1976 ano
42.317
-0.072
-0.17%
1 jan 1977 ano
41.764
-0.553
-1.31%
1 jan 1978 ano
40.618
-1.145
-2.74%
1 jan 1979 ano
39.329
-1.289
-3.17%
1 jan 1980 ano
39.232
-0.097
-0.25%
1 jan 1981 ano
39.244
+0.012
0.03%
1 jan 1982 ano
39.865
+0.621
1.58%
1 jan 1983 ano
39.329
-0.536
-1.34%
1 jan 1984 ano
38.551
-0.778
-1.98%
1 jan 1985 ano
37.25
-1.301
-3.37%
1 jan 1986 ano
36.667
-0.584
-1.57%
1 jan 1987 ano
37.326
+0.66
1.8%
1 jan 1988 ano
37.663
+0.337
0.9%
1 jan 1989 ano
37.81
+0.147
0.39%
1 jan 1990 ano
38.271
+0.46
1.22%
1 jan 1991 ano
38.5
+0.229
0.6%
1 jan 1992 ano
39.163
+0.663
1.72%
1 jan 1993 ano
38.415
-0.748
-1.91%
1 jan 1994 ano
37.594
-0.821
-2.14%
1 jan 1995 ano
37.658
+0.063
0.17%
1 jan 1996 ano
37.546
-0.112
-0.3%
1 jan 1997 ano
37.429
-0.117
-0.31%
1 jan 1998 ano
37.829
+0.4
1.07%
1 jan 1999 ano
37.196
-0.633
-1.67%
1 jan 2000 ano
37.098
-0.098
-0.26%
1 jan 2001 ano
37.291
+0.193
0.52%
1 jan 2002 ano
38.302
+1.011
2.71%
1 jan 2003 ano
38.927
+0.625
1.63%
1 jan 2004 ano
38.789
-0.138
-0.35%
1 jan 2005 ano
38.246
-0.543
-1.4%
1 jan 2006 ano
38.077
-0.17
-0.44%
1 jan 2007 ano
38.174
+0.097
0.26%
1 jan 2008 ano
38.15
-0.024
-0.06%
1 jan 2009 ano
38.675
+0.525
1.38%
1 jan 2010 ano
38.916
+0.241
0.62%
1 jan 2011 ano
39.134
+0.217
0.56%
1 jan 2012 ano
38.782
-0.352
-0.9%
1 jan 2013 ano
39.12
+0.338
0.87%
1 jan 2014 ano
40.206
+1.086
2.78%
1 jan 2015 ano
41.536
+1.33
3.31%
Classificação de países por estatísticas atuais por anos


Comentários: