29
/pt/
pt
AIzaSyAYiBZKx7MnpbEhh9jyipgxe19OcubqV5w
April 1, 2024
28493
East Asia & Pacific (excluding high income)
EAP
false
2
1
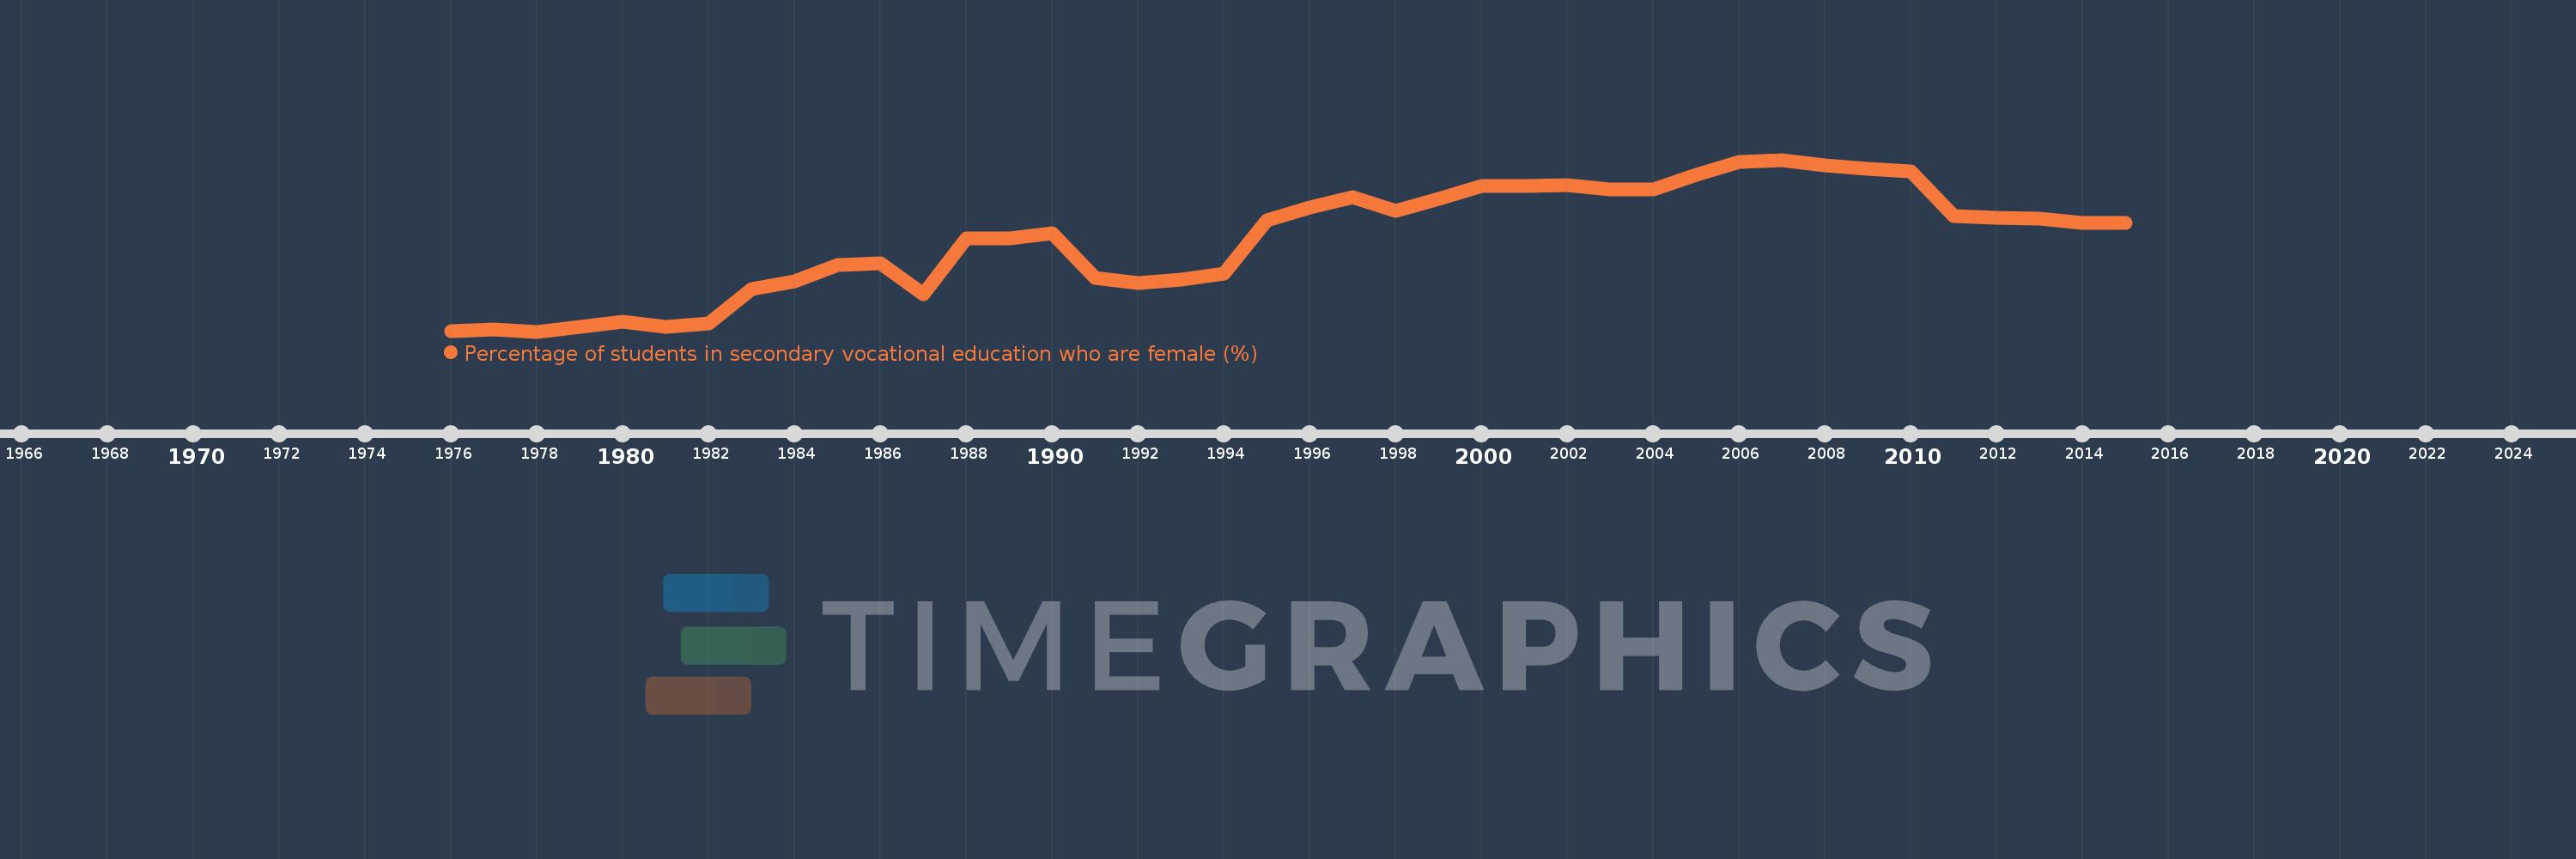
Percentage of students in secondary vocational education who are female (%)
2015,2014,2013,2012,2011,2010,2009,2008,2007,2006,2005,2004,2003,2002,2001,2000,1999,1998,1997,1996,1995,1994,1993,1992,1991,1990,1989,1988,1987,1986,1985,1984,1983,1982,1981,1980,1979,1978,1977,1976
Estas estatísticas em outros países:
AfghanistanAlbaniaAlgeriaAndorraAngolaAntigua and BarbudaArab WorldArgentinaArmeniaArubaAustraliaAustriaAzerbaijanBahrainBangladeshBarbadosBelarusBelgiumBelizeBeninBermudaBhutanBoliviaBosnia and HerzegovinaBotswanaBrazilBritish Virgin IslandsBrunei DarussalamBulgariaBurkina FasoBurundiCabo VerdeCambodiaCameroonCanadaCaribbean small statesCentral African RepublicCentral Europe and the BalticsChadChileChinaColombiaComorosCongo, Dem. Rep.Congo, Rep.Costa RicaCote d'IvoireCroatiaCubaCuracaoCyprusCzech RepublicDenmarkDjiboutiDominicaDominican RepublicEarly-demographic dividendEast Asia & PacificEast Asia & Pacific (excluding high income)East Asia & Pacific (IDA & IBRD countries)EcuadorEgypt, Arab Rep.El SalvadorEquatorial GuineaEritreaEstoniaEthiopiaEuro areaEurope & Central AsiaEurope & Central Asia (excluding high income)Europe & Central Asia (IDA & IBRD countries)European UnionFijiFinlandFragile and conflict affected situationsFranceGabonGambia, TheGeorgiaGermanyGhanaGibraltarGreeceGrenadaGuatemalaGuineaGuinea-BissauGuyanaHaitiHeavily indebted poor countries (HIPC)High incomeHondurasHong Kong SAR, ChinaHungaryIBRD onlyIcelandIDA & IBRD totalIDA blendIDA onlyIDA totalIndiaIndonesiaIran, Islamic Rep.IraqIrelandIsraelItalyJamaicaJapanJordanKazakhstanKenyaKiribatiKorea, Rep.KuwaitKyrgyz RepublicLao PDRLate-demographic dividendLatin America & Caribbean Latin America & Caribbean (excluding high income)Latin America & the Caribbean (IDA & IBRD countries)LatviaLeast developed countries: UN classificationLebanonLesothoLiberiaLibyaLiechtensteinLithuaniaLow & middle incomeLow incomeLower middle incomeLuxembourgMacao SAR, ChinaMacedonia, FYRMadagascarMalawiMalaysiaMaldivesMaliMaltaMarshall IslandsMauritaniaMauritiusMexicoMicronesia, Fed. Sts.Middle East & North AfricaMiddle East & North Africa (excluding high income)Middle East & North Africa (IDA & IBRD countries)Middle incomeMoldovaMonacoMongoliaMontenegroMoroccoMozambiqueMyanmarNamibiaNauruNepalNetherlandsNew ZealandNicaraguaNigerNigeriaNorth AmericaNorwayOECD membersOmanOther small statesPacific island small statesPakistanPanamaPapua New GuineaParaguayPeruPolandPortugalPost-demographic dividendPre-demographic dividendPuerto RicoQatarRomaniaRussian FederationRwandaSamoaSan MarinoSao Tome and PrincipeSaudi ArabiaSenegalSerbiaSeychellesSierra LeoneSingaporeSint Maarten (Dutch part)Slovak RepublicSloveniaSmall statesSolomon IslandsSomaliaSouth AfricaSouth AsiaSouth Asia (IDA & IBRD)SpainSri LankaSt. Kitts and NevisSt. LuciaSt. Vincent and the GrenadinesSub-Saharan Africa Sub-Saharan Africa (excluding high income)Sub-Saharan Africa (IDA & IBRD countries)SudanSurinameSwazilandSwedenSwitzerlandSyrian Arab RepublicTajikistanTanzaniaThailandTimor-LesteTogoTongaTrinidad and TobagoTunisiaTurkeyTurkmenistanTurks and Caicos IslandsTuvaluUgandaUkraineUnited Arab EmiratesUnited KingdomUpper middle incomeUruguayUzbekistanVanuatuVenezuela, RBVietnamWest Bank and GazaWorldYemen, Rep.ZambiaZimbabwe Linha do tempo:
Nesta escala de tempo está apresentado um gráfico de 1976 ano até 2015 ano East Asia & Pacific (excluding high income). Dados de 1975 ano ausente. O número de observações reais por data: 40.
Fonte (nome):
Indicadores de desenvolvimento mundial
Fonte (organização):
UNESCO Institute for Statistics
Categorias:
Education, Gender
Foi atualizado:
23 abr 2017 ano
Indicadores de alterações dos valores ao longo dos anos
Mínimo:
34.786
1 jan 1978 ano
Máximo:
49.48
1 jan 2007 ano
Na data de observação
Valor
Mudança absoluta
A alteração em relação ao valor anterior
1 jan 1976 ano
34.794
+34.794
0.0%
1 jan 1977 ano
34.994
+0.2
0.57%
1 jan 1978 ano
34.786
-0.208
-0.59%
1 jan 1979 ano
35.186
+0.399
1.15%
1 jan 1980 ano
35.636
+0.45
1.28%
1 jan 1981 ano
35.184
-0.452
-1.27%
1 jan 1982 ano
35.493
+0.309
0.88%
1 jan 1983 ano
38.427
+2.934
8.27%
1 jan 1984 ano
39.112
+0.685
1.78%
1 jan 1985 ano
40.509
+1.397
3.57%
1 jan 1986 ano
40.615
+0.106
0.26%
1 jan 1987 ano
37.965
-2.65
-6.53%
1 jan 1988 ano
42.792
+4.827
12.71%
1 jan 1989 ano
42.785
-0.007
-0.02%
1 jan 1990 ano
43.185
+0.4
0.93%
1 jan 1991 ano
39.412
-3.773
-8.74%
1 jan 1992 ano
38.901
-0.511
-1.3%
1 jan 1993 ano
39.238
+0.337
0.87%
1 jan 1994 ano
39.736
+0.498
1.27%
1 jan 1995 ano
44.287
+4.551
11.45%
1 jan 1996 ano
45.408
+1.121
2.53%
1 jan 1997 ano
46.3
+0.892
1.96%
1 jan 1998 ano
45.105
-1.195
-2.58%
1 jan 1999 ano
46.106
+1.0
2.22%
1 jan 2000 ano
47.204
+1.098
2.38%
1 jan 2001 ano
47.214
+0.01
0.02%
1 jan 2002 ano
47.308
+0.093
0.2%
1 jan 2003 ano
46.927
-0.381
-0.8%
1 jan 2004 ano
46.964
+0.037
0.08%
1 jan 2005 ano
48.224
+1.26
2.68%
1 jan 2006 ano
49.266
+1.042
2.16%
1 jan 2007 ano
49.48
+0.215
0.44%
1 jan 2008 ano
49.001
-0.48
-0.97%
1 jan 2009 ano
48.724
-0.277
-0.57%
1 jan 2010 ano
48.512
-0.212
-0.43%
1 jan 2011 ano
44.653
-3.859
-7.95%
1 jan 2012 ano
44.538
-0.115
-0.26%
1 jan 2013 ano
44.443
-0.095
-0.21%
1 jan 2014 ano
44.064
-0.38
-0.85%
1 jan 2015 ano
44.106
+0.042
0.1%
Classificação de países por estatísticas atuais por anos


Comentários: