29
/pt/
pt
AIzaSyAYiBZKx7MnpbEhh9jyipgxe19OcubqV5w
April 1, 2024
238627
Seychelles
SYC
true
2
1
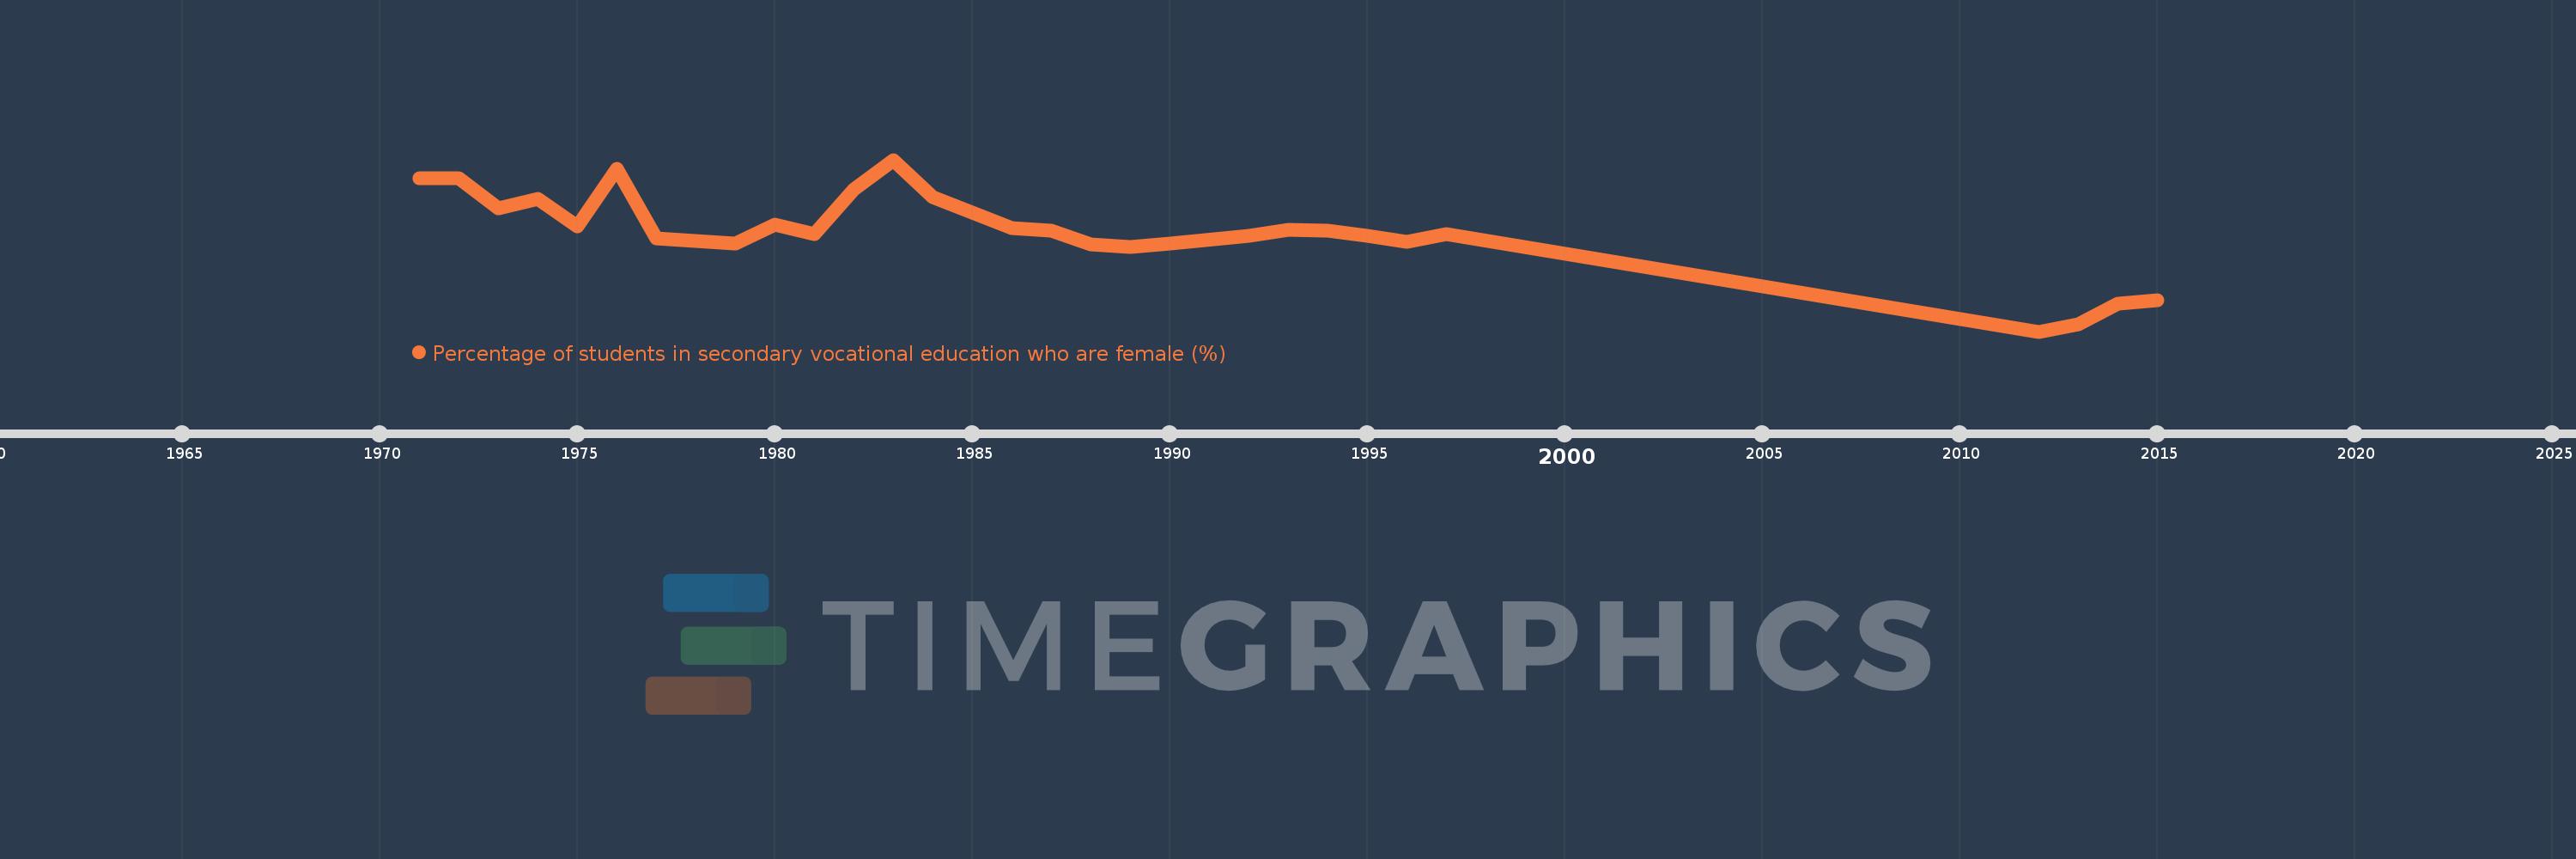
Percentage of students in secondary vocational education who are female (%)
2015,2014,2013,2012,1997,1996,1995,1994,1993,1992,1990,1989,1988,1987,1986,1984,1983,1982,1981,1980,1979,1977,1976,1975,1974,1973,1972,1971
Estas estatísticas em outros países:
AfghanistanAlbaniaAlgeriaAndorraAngolaAntigua and BarbudaArab WorldArgentinaArmeniaArubaAustraliaAustriaAzerbaijanBahrainBangladeshBarbadosBelarusBelgiumBelizeBeninBermudaBhutanBoliviaBosnia and HerzegovinaBotswanaBrazilBritish Virgin IslandsBrunei DarussalamBulgariaBurkina FasoBurundiCabo VerdeCambodiaCameroonCanadaCaribbean small statesCentral African RepublicCentral Europe and the BalticsChadChileChinaColombiaComorosCongo, Dem. Rep.Congo, Rep.Costa RicaCote d'IvoireCroatiaCubaCuracaoCyprusCzech RepublicDenmarkDjiboutiDominicaDominican RepublicEarly-demographic dividendEast Asia & PacificEast Asia & Pacific (excluding high income)East Asia & Pacific (IDA & IBRD countries)EcuadorEgypt, Arab Rep.El SalvadorEquatorial GuineaEritreaEstoniaEthiopiaEuro areaEurope & Central AsiaEurope & Central Asia (excluding high income)Europe & Central Asia (IDA & IBRD countries)European UnionFijiFinlandFragile and conflict affected situationsFranceGabonGambia, TheGeorgiaGermanyGhanaGibraltarGreeceGrenadaGuatemalaGuineaGuinea-BissauGuyanaHaitiHeavily indebted poor countries (HIPC)High incomeHondurasHong Kong SAR, ChinaHungaryIBRD onlyIcelandIDA & IBRD totalIDA blendIDA onlyIDA totalIndiaIndonesiaIran, Islamic Rep.IraqIrelandIsraelItalyJamaicaJapanJordanKazakhstanKenyaKiribatiKorea, Rep.KuwaitKyrgyz RepublicLao PDRLate-demographic dividendLatin America & Caribbean Latin America & Caribbean (excluding high income)Latin America & the Caribbean (IDA & IBRD countries)LatviaLeast developed countries: UN classificationLebanonLesothoLiberiaLibyaLiechtensteinLithuaniaLow & middle incomeLow incomeLower middle incomeLuxembourgMacao SAR, ChinaMacedonia, FYRMadagascarMalawiMalaysiaMaldivesMaliMaltaMarshall IslandsMauritaniaMauritiusMexicoMicronesia, Fed. Sts.Middle East & North AfricaMiddle East & North Africa (excluding high income)Middle East & North Africa (IDA & IBRD countries)Middle incomeMoldovaMonacoMongoliaMontenegroMoroccoMozambiqueMyanmarNamibiaNauruNepalNetherlandsNew ZealandNicaraguaNigerNigeriaNorth AmericaNorwayOECD membersOmanOther small statesPacific island small statesPakistanPanamaPapua New GuineaParaguayPeruPolandPortugalPost-demographic dividendPre-demographic dividendPuerto RicoQatarRomaniaRussian FederationRwandaSamoaSan MarinoSao Tome and PrincipeSaudi ArabiaSenegalSerbiaSeychellesSierra LeoneSingaporeSint Maarten (Dutch part)Slovak RepublicSloveniaSmall statesSolomon IslandsSomaliaSouth AfricaSouth AsiaSouth Asia (IDA & IBRD)SpainSri LankaSt. Kitts and NevisSt. LuciaSt. Vincent and the GrenadinesSub-Saharan Africa Sub-Saharan Africa (excluding high income)Sub-Saharan Africa (IDA & IBRD countries)SudanSurinameSwazilandSwedenSwitzerlandSyrian Arab RepublicTajikistanTanzaniaThailandTimor-LesteTogoTongaTrinidad and TobagoTunisiaTurkeyTurkmenistanTurks and Caicos IslandsTuvaluUgandaUkraineUnited Arab EmiratesUnited KingdomUpper middle incomeUruguayUzbekistanVanuatuVenezuela, RBVietnamWest Bank and GazaWorldYemen, Rep.ZambiaZimbabwe Linha do tempo:
Nesta escala de tempo está apresentado um gráfico de 1971 ano até 2015 ano Seychelles. Dados de 1970 ano ausente. O número de observações reais por data: 28.
Fonte (nome):
Indicadores de desenvolvimento mundial
Fonte (organização):
UNESCO Institute for Statistics
Categorias:
Education, Gender
Foi atualizado:
23 abr 2017 ano
Indicadores de alterações dos valores ao longo dos anos
Mínimo:
11.429
1 jan 2012 ano
Máximo:
74.938
1 jan 1983 ano
Na data de observação
Valor
Mudança absoluta
A alteração em relação ao valor anterior
1 jan 1971 ano
67.982
+67.982
0.0%
1 jan 1972 ano
68.269
+0.287
0.42%
1 jan 1973 ano
57.143
-11.126
-16.3%
1 jan 1974 ano
60.526
+3.383
5.92%
1 jan 1975 ano
50.37
-10.156
-16.78%
1 jan 1976 ano
71.565
+21.195
42.08%
1 jan 1977 ano
45.763
-25.803
-36.05%
1 jan 1979 ano
44.061
-1.701
-3.72%
1 jan 1980 ano
51.107
+7.046
15.99%
1 jan 1981 ano
47.534
-3.573
-6.99%
1 jan 1982 ano
63.913
+16.379
34.46%
1 jan 1983 ano
74.938
+11.025
17.25%
1 jan 1984 ano
60.996
-13.942
-18.6%
1 jan 1986 ano
49.61
-11.385
-18.67%
1 jan 1987 ano
48.864
-0.746
-1.5%
1 jan 1988 ano
43.555
-5.309
-10.87%
1 jan 1989 ano
42.847
-0.708
-1.63%
1 jan 1990 ano
44.038
+1.191
2.78%
1 jan 1992 ano
46.88
+2.842
6.45%
1 jan 1993 ano
48.901
+2.022
4.31%
1 jan 1994 ano
48.739
-0.162
-0.33%
1 jan 1995 ano
46.971
-1.769
-3.63%
1 jan 1996 ano
44.656
-2.315
-4.93%
1 jan 1997 ano
47.574
+2.918
6.53%
1 jan 2012 ano
11.429
-36.145
-75.98%
1 jan 2013 ano
14.286
+2.857
25.0%
1 jan 2014 ano
21.681
+7.396
51.77%
1 jan 2015 ano
22.917
+1.235
5.7%
Classificação de países por estatísticas atuais por anos


Comentários: