29
/pt/
pt
AIzaSyAYiBZKx7MnpbEhh9jyipgxe19OcubqV5w
April 1, 2024
256708
Sweden
SWE
true
2
1
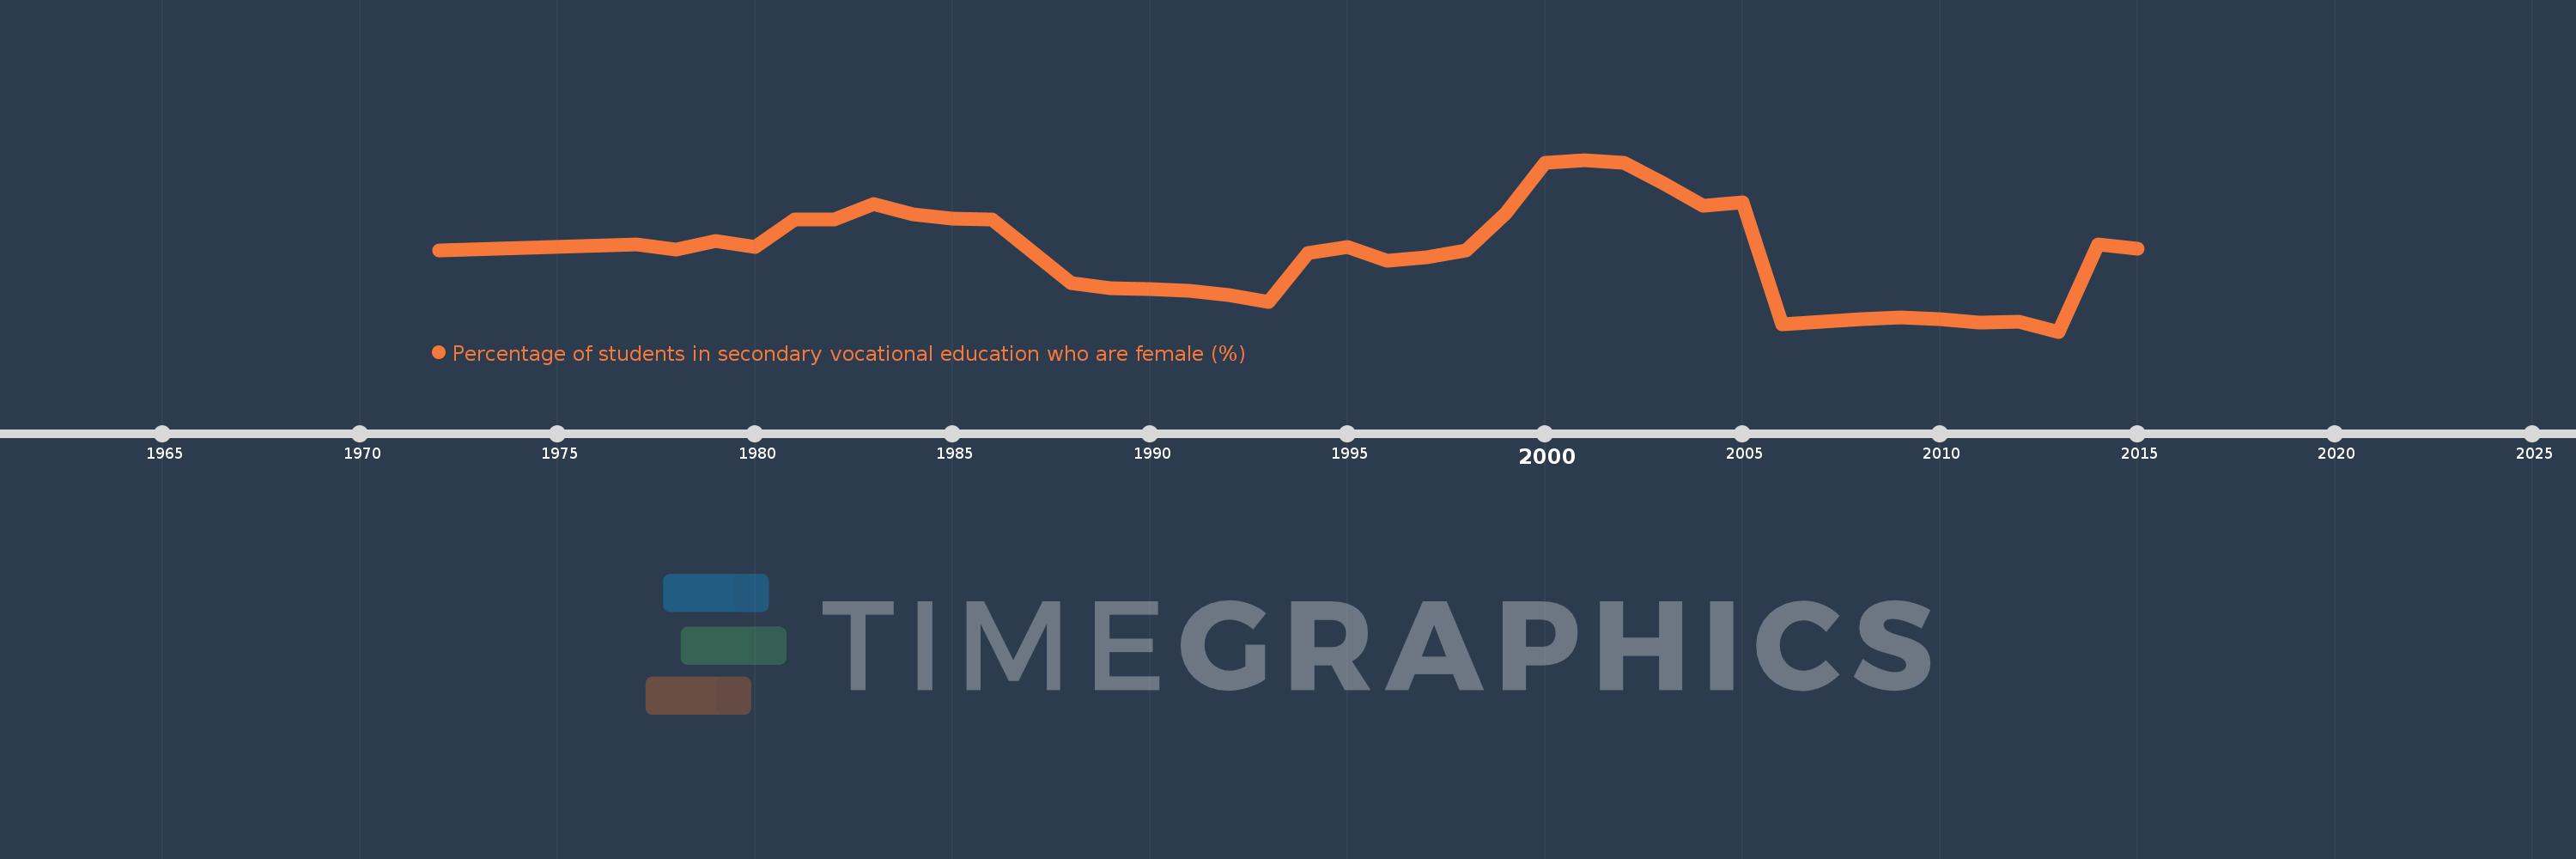
Percentage of students in secondary vocational education who are female (%)
2015,2014,2013,2012,2011,2010,2009,2008,2007,2006,2005,2004,2003,2002,2001,2000,1999,1998,1997,1996,1995,1994,1993,1992,1991,1990,1989,1988,1986,1985,1984,1983,1982,1981,1980,1979,1978,1977,1972
Estas estatísticas em outros países:
AfghanistanAlbaniaAlgeriaAndorraAngolaAntigua and BarbudaArab WorldArgentinaArmeniaArubaAustraliaAustriaAzerbaijanBahrainBangladeshBarbadosBelarusBelgiumBelizeBeninBermudaBhutanBoliviaBosnia and HerzegovinaBotswanaBrazilBritish Virgin IslandsBrunei DarussalamBulgariaBurkina FasoBurundiCabo VerdeCambodiaCameroonCanadaCaribbean small statesCentral African RepublicCentral Europe and the BalticsChadChileChinaColombiaComorosCongo, Dem. Rep.Congo, Rep.Costa RicaCote d'IvoireCroatiaCubaCuracaoCyprusCzech RepublicDenmarkDjiboutiDominicaDominican RepublicEarly-demographic dividendEast Asia & PacificEast Asia & Pacific (excluding high income)East Asia & Pacific (IDA & IBRD countries)EcuadorEgypt, Arab Rep.El SalvadorEquatorial GuineaEritreaEstoniaEthiopiaEuro areaEurope & Central AsiaEurope & Central Asia (excluding high income)Europe & Central Asia (IDA & IBRD countries)European UnionFijiFinlandFragile and conflict affected situationsFranceGabonGambia, TheGeorgiaGermanyGhanaGibraltarGreeceGrenadaGuatemalaGuineaGuinea-BissauGuyanaHaitiHeavily indebted poor countries (HIPC)High incomeHondurasHong Kong SAR, ChinaHungaryIBRD onlyIcelandIDA & IBRD totalIDA blendIDA onlyIDA totalIndiaIndonesiaIran, Islamic Rep.IraqIrelandIsraelItalyJamaicaJapanJordanKazakhstanKenyaKiribatiKorea, Rep.KuwaitKyrgyz RepublicLao PDRLate-demographic dividendLatin America & Caribbean Latin America & Caribbean (excluding high income)Latin America & the Caribbean (IDA & IBRD countries)LatviaLeast developed countries: UN classificationLebanonLesothoLiberiaLibyaLiechtensteinLithuaniaLow & middle incomeLow incomeLower middle incomeLuxembourgMacao SAR, ChinaMacedonia, FYRMadagascarMalawiMalaysiaMaldivesMaliMaltaMarshall IslandsMauritaniaMauritiusMexicoMicronesia, Fed. Sts.Middle East & North AfricaMiddle East & North Africa (excluding high income)Middle East & North Africa (IDA & IBRD countries)Middle incomeMoldovaMonacoMongoliaMontenegroMoroccoMozambiqueMyanmarNamibiaNauruNepalNetherlandsNew ZealandNicaraguaNigerNigeriaNorth AmericaNorwayOECD membersOmanOther small statesPacific island small statesPakistanPanamaPapua New GuineaParaguayPeruPolandPortugalPost-demographic dividendPre-demographic dividendPuerto RicoQatarRomaniaRussian FederationRwandaSamoaSan MarinoSao Tome and PrincipeSaudi ArabiaSenegalSerbiaSeychellesSierra LeoneSingaporeSint Maarten (Dutch part)Slovak RepublicSloveniaSmall statesSolomon IslandsSomaliaSouth AfricaSouth AsiaSouth Asia (IDA & IBRD)SpainSri LankaSt. Kitts and NevisSt. LuciaSt. Vincent and the GrenadinesSub-Saharan Africa Sub-Saharan Africa (excluding high income)Sub-Saharan Africa (IDA & IBRD countries)SudanSurinameSwazilandSwedenSwitzerlandSyrian Arab RepublicTajikistanTanzaniaThailandTimor-LesteTogoTongaTrinidad and TobagoTunisiaTurkeyTurkmenistanTurks and Caicos IslandsTuvaluUgandaUkraineUnited Arab EmiratesUnited KingdomUpper middle incomeUruguayUzbekistanVanuatuVenezuela, RBVietnamWest Bank and GazaWorldYemen, Rep.ZambiaZimbabwe Linha do tempo:
Nesta escala de tempo está apresentado um gráfico de 1972 ano até 2015 ano Sweden. Dados de 1971 ano ausente. O número de observações reais por data: 39.
Fonte (nome):
Indicadores de desenvolvimento mundial
Fonte (organização):
UNESCO Institute for Statistics
Categorias:
Education, Gender
Foi atualizado:
23 abr 2017 ano
Indicadores de alterações dos valores ao longo dos anos
Mínimo:
43.085
1 jan 2013 ano
Máximo:
57.046
1 jan 2001 ano
Na data de observação
Valor
Mudança absoluta
A alteração em relação ao valor anterior
1 jan 1972 ano
49.647
+49.647
0.0%
1 jan 1977 ano
50.14
+0.493
0.99%
1 jan 1978 ano
49.745
-0.395
-0.79%
1 jan 1979 ano
50.432
+0.687
1.38%
1 jan 1980 ano
49.958
-0.474
-0.94%
1 jan 1981 ano
52.228
+2.27
4.54%
1 jan 1982 ano
52.176
-0.053
-0.1%
1 jan 1983 ano
53.482
+1.306
2.5%
1 jan 1984 ano
52.618
-0.864
-1.62%
1 jan 1985 ano
52.253
-0.365
-0.69%
1 jan 1986 ano
52.167
-0.086
-0.17%
1 jan 1988 ano
47.014
-5.153
-9.88%
1 jan 1989 ano
46.631
-0.383
-0.81%
1 jan 1990 ano
46.552
-0.078
-0.17%
1 jan 1991 ano
46.381
-0.171
-0.37%
1 jan 1992 ano
46.038
-0.343
-0.74%
1 jan 1993 ano
45.511
-0.526
-1.14%
1 jan 1994 ano
49.449
+3.937
8.65%
1 jan 1995 ano
49.964
+0.516
1.04%
1 jan 1996 ano
48.845
-1.119
-2.24%
1 jan 1997 ano
49.121
+0.276
0.56%
1 jan 1998 ano
49.708
+0.587
1.19%
1 jan 1999 ano
52.681
+2.973
5.98%
1 jan 2000 ano
56.817
+4.136
7.85%
1 jan 2001 ano
57.046
+0.229
0.4%
1 jan 2002 ano
56.782
-0.264
-0.46%
1 jan 2003 ano
55.147
-1.635
-2.88%
1 jan 2004 ano
53.312
-1.835
-3.33%
1 jan 2005 ano
53.619
+0.308
0.58%
1 jan 2006 ano
43.657
-9.963
-18.58%
1 jan 2007 ano
43.889
+0.232
0.53%
1 jan 2008 ano
44.115
+0.226
0.52%
1 jan 2009 ano
44.224
+0.109
0.25%
1 jan 2010 ano
44.105
-0.12
-0.27%
1 jan 2011 ano
43.823
-0.282
-0.64%
1 jan 2012 ano
43.882
+0.059
0.14%
1 jan 2013 ano
43.085
-0.797
-1.82%
1 jan 2014 ano
50.174
+7.088
16.45%
1 jan 2015 ano
49.827
-0.347
-0.69%
Classificação de países por estatísticas atuais por anos


Comentários: