29
/pt/
pt
AIzaSyAYiBZKx7MnpbEhh9jyipgxe19OcubqV5w
April 1, 2024
85928
Bhutan
BTN
true
2
1
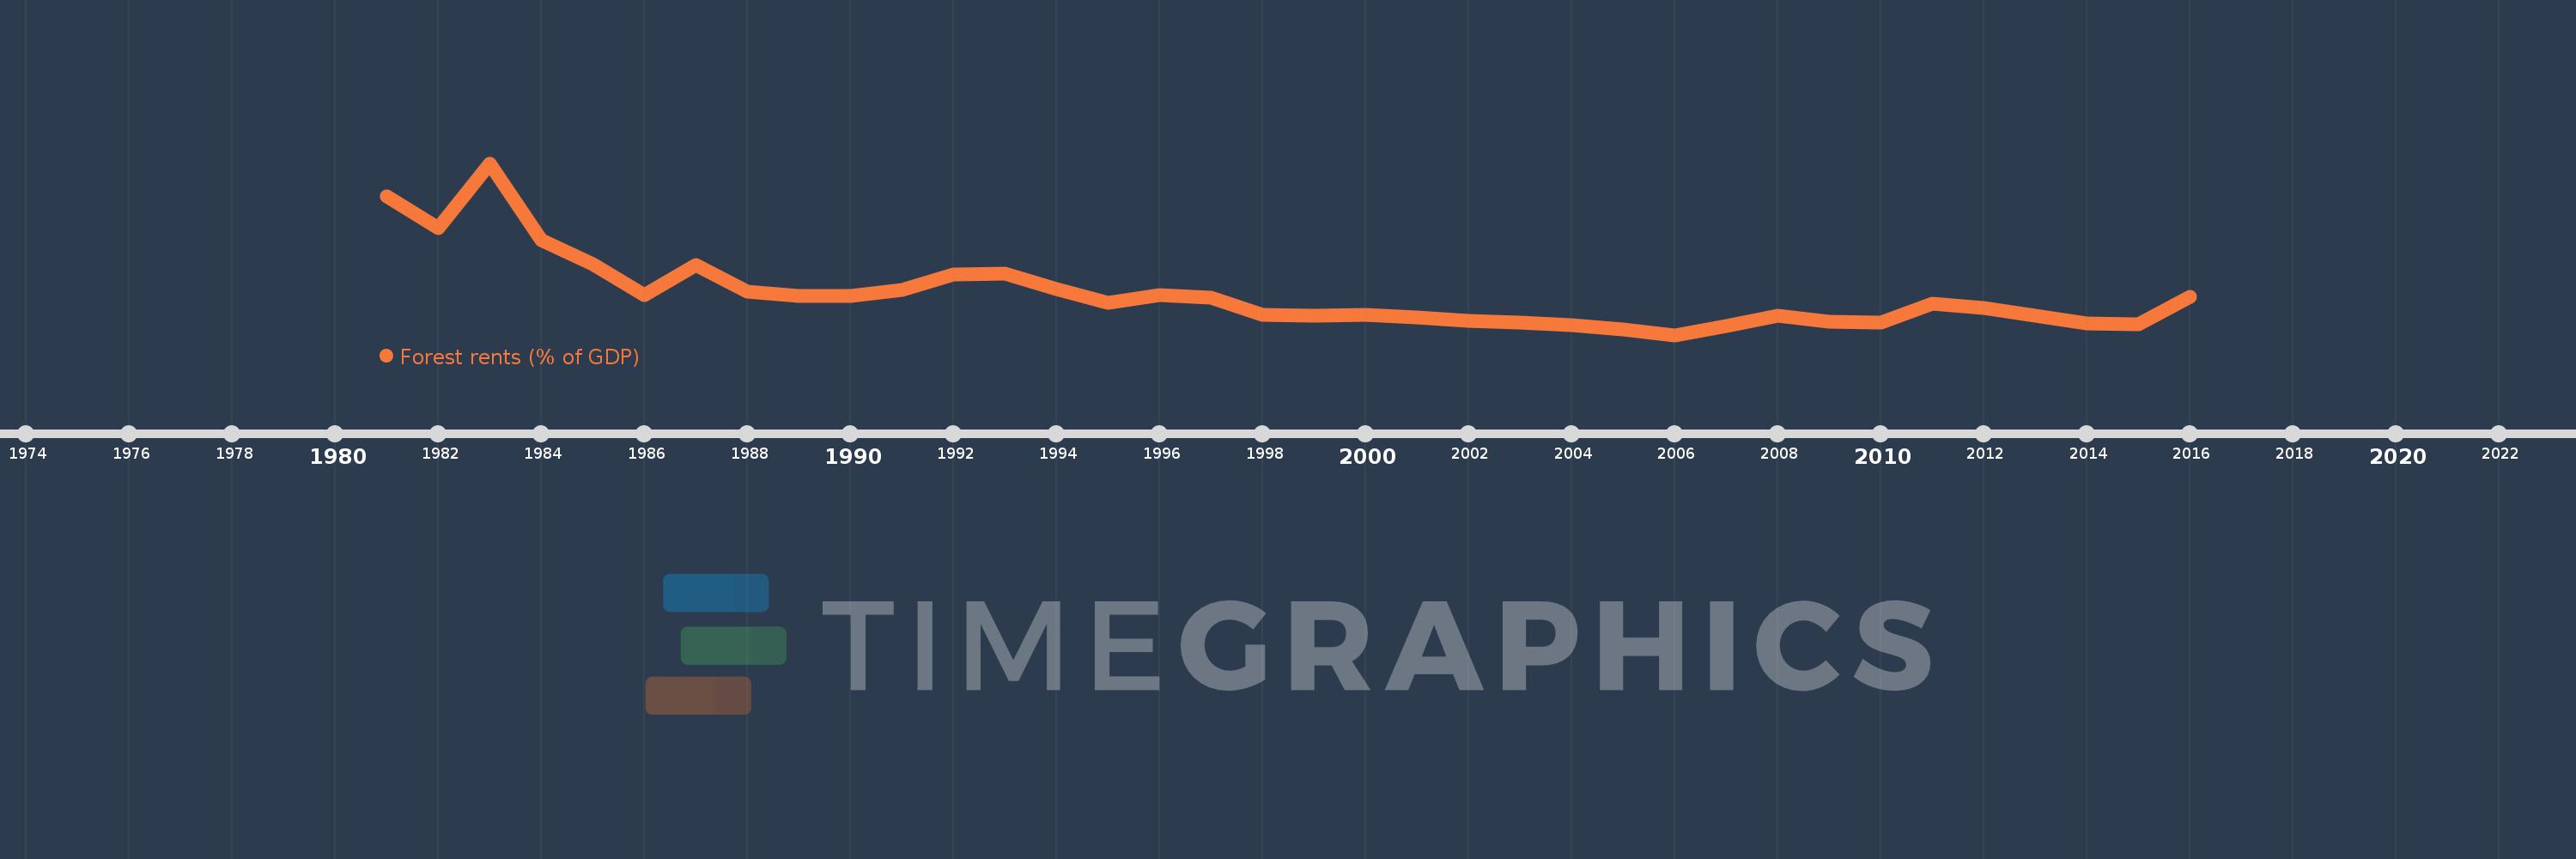
Forest rents (% of GDP)
2016,2015,2014,2013,2012,2011,2010,2009,2008,2007,2006,2005,2004,2003,2002,2001,2000,1999,1998,1997,1996,1995,1994,1993,1992,1991,1990,1989,1988,1987,1986,1985,1984,1983,1982,1981
Estas estatísticas em outros países:
AfghanistanAlbaniaAlgeriaAndorraAngolaArab WorldArgentinaArmeniaArubaAustraliaAustriaAzerbaijanBahamas, TheBahrainBangladeshBarbadosBelarusBelgiumBelizeBeninBhutanBoliviaBosnia and HerzegovinaBotswanaBrazilBrunei DarussalamBulgariaBurkina FasoBurundiCabo VerdeCambodiaCameroonCanadaCaribbean small statesCentral African RepublicCentral Europe and the BalticsChadChileChinaColombiaComorosCongo, Dem. Rep.Congo, Rep.Costa RicaCote d'IvoireCroatiaCubaCyprusCzech RepublicDenmarkDjiboutiDominicaDominican RepublicEarly-demographic dividendEast Asia & PacificEast Asia & Pacific (excluding high income)East Asia & Pacific (IDA & IBRD countries)EcuadorEgypt, Arab Rep.El SalvadorEquatorial GuineaEritreaEstoniaEthiopiaEuro areaEurope & Central AsiaEurope & Central Asia (excluding high income)Europe & Central Asia (IDA & IBRD countries)European UnionFaroe IslandsFijiFinlandFragile and conflict affected situationsFranceFrench PolynesiaGabonGambia, TheGeorgiaGermanyGhanaGreeceGuatemalaGuineaGuinea-BissauGuyanaHaitiHeavily indebted poor countries (HIPC)High incomeHondurasHong Kong SAR, ChinaHungaryIBRD onlyIcelandIDA & IBRD totalIDA blendIDA onlyIDA totalIndiaIndonesiaIran, Islamic Rep.IraqIrelandIsraelItalyJamaicaJapanJordanKazakhstanKenyaKiribatiKorea, Rep.KuwaitKyrgyz RepublicLao PDRLate-demographic dividendLatin America & Caribbean Latin America & Caribbean (excluding high income)Latin America & the Caribbean (IDA & IBRD countries)LatviaLeast developed countries: UN classificationLebanonLesothoLiberiaLibyaLiechtensteinLithuaniaLow & middle incomeLow incomeLower middle incomeLuxembourgMacao SAR, ChinaMacedonia, FYRMadagascarMalawiMalaysiaMaldivesMaliMaltaMauritaniaMauritiusMexicoMicronesia, Fed. Sts.Middle East & North AfricaMiddle East & North Africa (excluding high income)Middle East & North Africa (IDA & IBRD countries)Middle incomeMoldovaMongoliaMontenegroMoroccoMozambiqueMyanmarNamibiaNepalNetherlandsNew CaledoniaNew ZealandNicaraguaNigerNigeriaNorth AmericaNorwayOECD membersOmanOther small statesPacific island small statesPakistanPanamaPapua New GuineaParaguayPeruPhilippinesPolandPortugalPost-demographic dividendPre-demographic dividendQatarRomaniaRussian FederationRwandaSamoaSao Tome and PrincipeSaudi ArabiaSenegalSerbiaSeychellesSierra LeoneSingaporeSlovak RepublicSloveniaSmall statesSolomon IslandsSomaliaSouth AfricaSouth AsiaSouth Asia (IDA & IBRD)South SudanSpainSri LankaSt. LuciaSt. Vincent and the GrenadinesSub-Saharan Africa Sub-Saharan Africa (excluding high income)Sub-Saharan Africa (IDA & IBRD countries)SudanSurinameSwazilandSwedenSwitzerlandSyrian Arab RepublicTajikistanTanzaniaThailandTimor-LesteTogoTongaTrinidad and TobagoTunisiaTurkeyTurkmenistanUgandaUkraineUnited Arab EmiratesUnited KingdomUnited StatesUpper middle incomeUruguayUzbekistanVanuatuVenezuela, RBVietnamWorldYemen, Rep.ZambiaZimbabwe Linha do tempo:
Nesta escala de tempo está apresentado um gráfico de 1981 ano até 2016 ano Bhutan. Dados de 1980 ano ausente. O número de observações reais por data: 36.
Fonte (nome):
Indicadores de desenvolvimento mundial
Fonte (organização):
Estimates based on sources and methods described in "The Changing Wealth of Nations: Measuring Sustainable Development in the New Millennium" (World Bank, 2011).
Categorias:
Environment
Foi atualizado:
23 abr 2017 ano
Indicadores de alterações dos valores ao longo dos anos
Mínimo:
2.325
1 jan 2006 ano
Máximo:
16.408
1 jan 1983 ano
Na data de observação
Valor
Mudança absoluta
A alteração em relação ao valor anterior
1 jan 1981 ano
13.669
+13.669
0.0%
1 jan 1982 ano
11.125
-2.544
-18.61%
1 jan 1983 ano
16.408
+5.283
47.49%
1 jan 1984 ano
10.092
-6.316
-38.49%
1 jan 1985 ano
8.169
-1.922
-19.05%
1 jan 1986 ano
5.601
-2.568
-31.43%
1 jan 1987 ano
8.042
+2.44
43.57%
1 jan 1988 ano
5.894
-2.147
-26.7%
1 jan 1989 ano
5.511
-0.383
-6.5%
1 jan 1990 ano
5.523
+0.012
0.21%
1 jan 1991 ano
6.001
+0.478
8.66%
1 jan 1992 ano
7.27
+1.269
21.15%
1 jan 1993 ano
7.374
+0.104
1.43%
1 jan 1994 ano
6.123
-1.25
-16.96%
1 jan 1995 ano
4.944
-1.179
-19.26%
1 jan 1996 ano
5.594
+0.65
13.15%
1 jan 1997 ano
5.374
-0.221
-3.94%
1 jan 1998 ano
3.982
-1.391
-25.89%
1 jan 1999 ano
3.938
-0.044
-1.1%
1 jan 2000 ano
4.012
+0.074
1.88%
1 jan 2001 ano
3.769
-0.244
-6.07%
1 jan 2002 ano
3.519
-0.25
-6.63%
1 jan 2003 ano
3.323
-0.196
-5.56%
1 jan 2004 ano
3.137
-0.186
-5.61%
1 jan 2005 ano
2.771
-0.366
-11.66%
1 jan 2006 ano
2.325
-0.446
-16.1%
1 jan 2007 ano
3.033
+0.709
30.49%
1 jan 2008 ano
3.927
+0.893
29.45%
1 jan 2009 ano
3.447
-0.479
-12.21%
1 jan 2010 ano
3.328
-0.12
-3.47%
1 jan 2011 ano
4.916
+1.588
47.72%
1 jan 2012 ano
4.511
-0.404
-8.23%
1 jan 2013 ano
3.906
-0.606
-13.42%
1 jan 2014 ano
3.244
-0.662
-16.94%
1 jan 2015 ano
3.223
-0.021
-0.64%
1 jan 2016 ano
5.473
+2.25
69.79%
Classificação de países por estatísticas atuais por anos


Comentários: