29
/pt/
pt
AIzaSyAYiBZKx7MnpbEhh9jyipgxe19OcubqV5w
April 1, 2024
199128
Mongolia
MNG
true
2
1
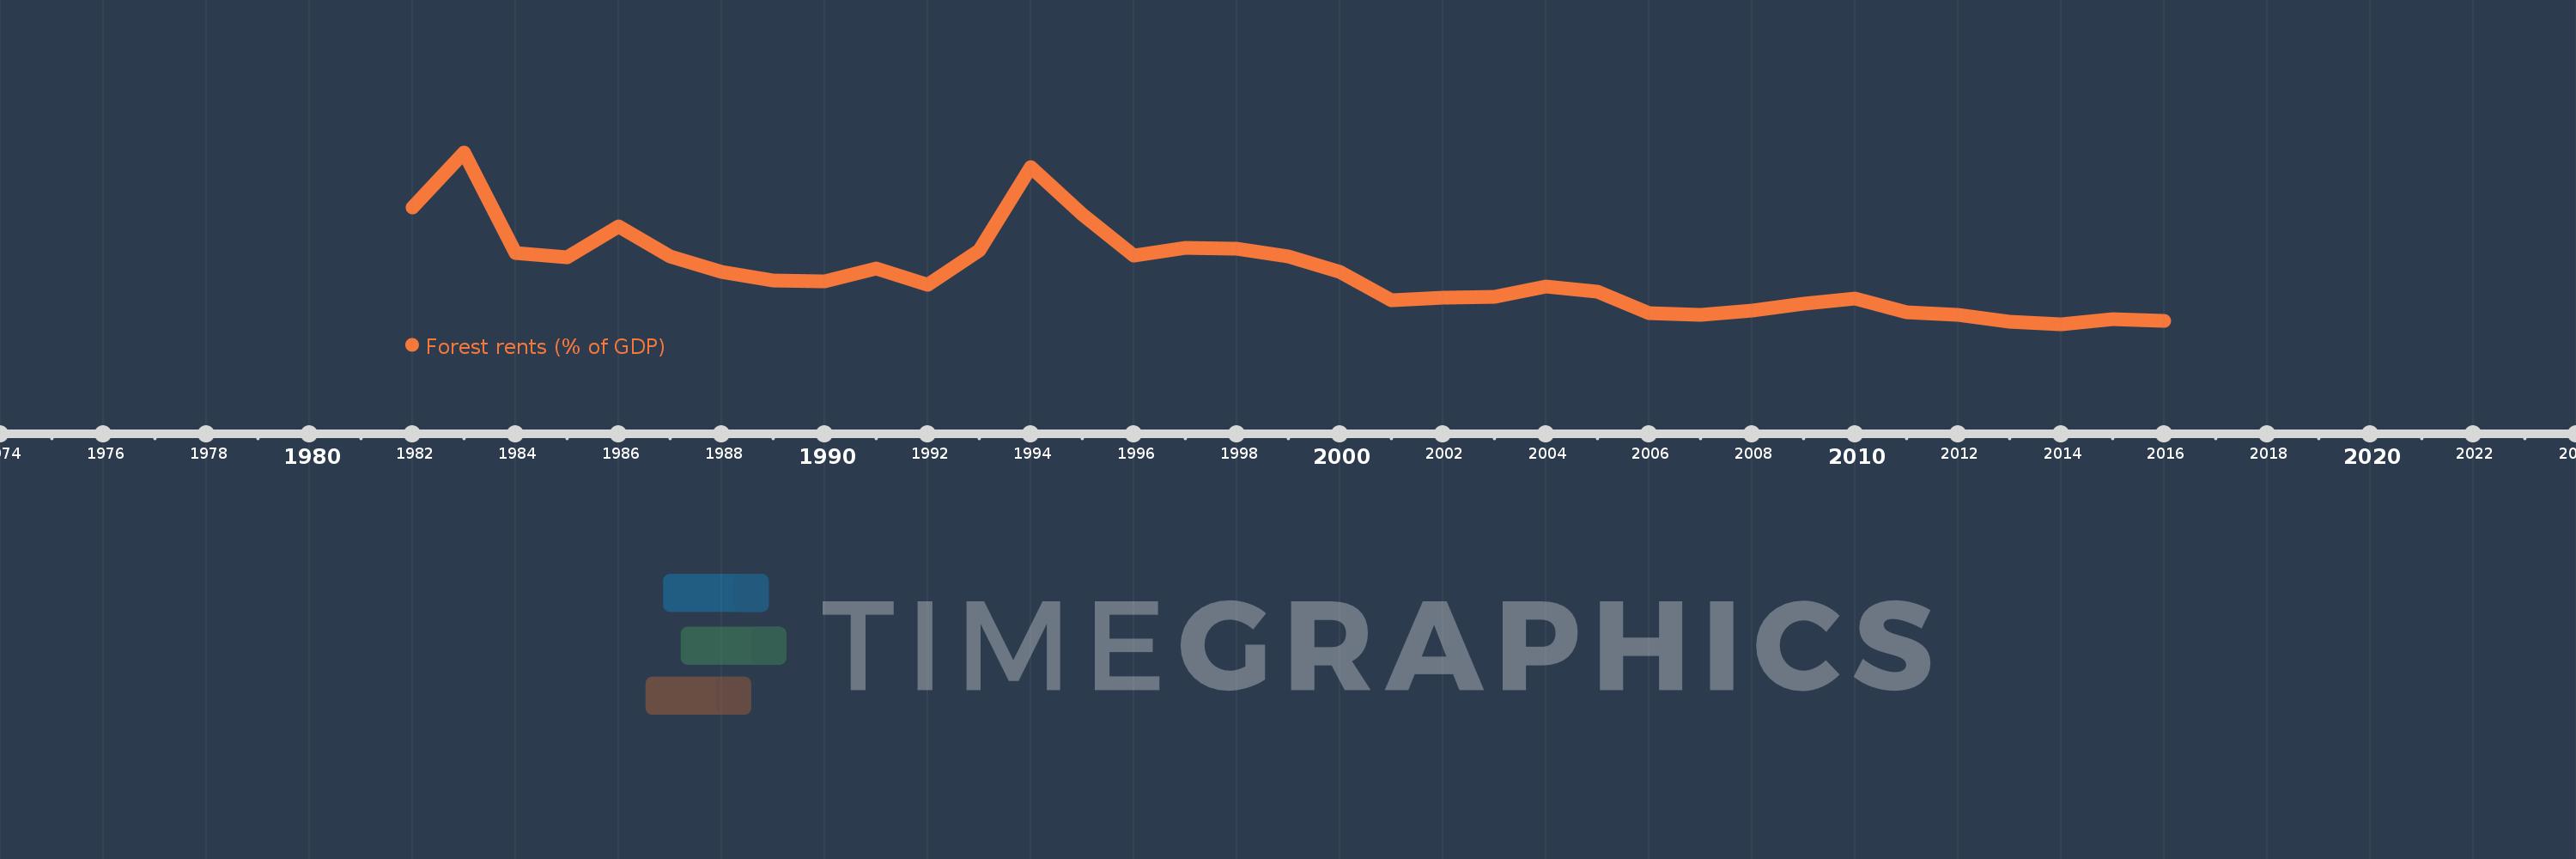
Forest rents (% of GDP)
2016,2015,2014,2013,2012,2011,2010,2009,2008,2007,2006,2005,2004,2003,2002,2001,2000,1999,1998,1997,1996,1995,1994,1993,1992,1991,1990,1989,1988,1987,1986,1985,1984,1983,1982
Estas estatísticas em outros países:
AfghanistanAlbaniaAlgeriaAndorraAngolaArab WorldArgentinaArmeniaArubaAustraliaAustriaAzerbaijanBahamas, TheBahrainBangladeshBarbadosBelarusBelgiumBelizeBeninBhutanBoliviaBosnia and HerzegovinaBotswanaBrazilBrunei DarussalamBulgariaBurkina FasoBurundiCabo VerdeCambodiaCameroonCanadaCaribbean small statesCentral African RepublicCentral Europe and the BalticsChadChileChinaColombiaComorosCongo, Dem. Rep.Congo, Rep.Costa RicaCote d'IvoireCroatiaCubaCyprusCzech RepublicDenmarkDjiboutiDominicaDominican RepublicEarly-demographic dividendEast Asia & PacificEast Asia & Pacific (excluding high income)East Asia & Pacific (IDA & IBRD countries)EcuadorEgypt, Arab Rep.El SalvadorEquatorial GuineaEritreaEstoniaEthiopiaEuro areaEurope & Central AsiaEurope & Central Asia (excluding high income)Europe & Central Asia (IDA & IBRD countries)European UnionFaroe IslandsFijiFinlandFragile and conflict affected situationsFranceFrench PolynesiaGabonGambia, TheGeorgiaGermanyGhanaGreeceGuatemalaGuineaGuinea-BissauGuyanaHaitiHeavily indebted poor countries (HIPC)High incomeHondurasHong Kong SAR, ChinaHungaryIBRD onlyIcelandIDA & IBRD totalIDA blendIDA onlyIDA totalIndiaIndonesiaIran, Islamic Rep.IraqIrelandIsraelItalyJamaicaJapanJordanKazakhstanKenyaKiribatiKorea, Rep.KuwaitKyrgyz RepublicLao PDRLate-demographic dividendLatin America & Caribbean Latin America & Caribbean (excluding high income)Latin America & the Caribbean (IDA & IBRD countries)LatviaLeast developed countries: UN classificationLebanonLesothoLiberiaLibyaLiechtensteinLithuaniaLow & middle incomeLow incomeLower middle incomeLuxembourgMacao SAR, ChinaMacedonia, FYRMadagascarMalawiMalaysiaMaldivesMaliMaltaMauritaniaMauritiusMexicoMicronesia, Fed. Sts.Middle East & North AfricaMiddle East & North Africa (excluding high income)Middle East & North Africa (IDA & IBRD countries)Middle incomeMoldovaMongoliaMontenegroMoroccoMozambiqueMyanmarNamibiaNepalNetherlandsNew CaledoniaNew ZealandNicaraguaNigerNigeriaNorth AmericaNorwayOECD membersOmanOther small statesPacific island small statesPakistanPanamaPapua New GuineaParaguayPeruPhilippinesPolandPortugalPost-demographic dividendPre-demographic dividendQatarRomaniaRussian FederationRwandaSamoaSao Tome and PrincipeSaudi ArabiaSenegalSerbiaSeychellesSierra LeoneSingaporeSlovak RepublicSloveniaSmall statesSolomon IslandsSomaliaSouth AfricaSouth AsiaSouth Asia (IDA & IBRD)South SudanSpainSri LankaSt. LuciaSt. Vincent and the GrenadinesSub-Saharan Africa Sub-Saharan Africa (excluding high income)Sub-Saharan Africa (IDA & IBRD countries)SudanSurinameSwazilandSwedenSwitzerlandSyrian Arab RepublicTajikistanTanzaniaThailandTimor-LesteTogoTongaTrinidad and TobagoTunisiaTurkeyTurkmenistanUgandaUkraineUnited Arab EmiratesUnited KingdomUnited StatesUpper middle incomeUruguayUzbekistanVanuatuVenezuela, RBVietnamWorldYemen, Rep.ZambiaZimbabwe Linha do tempo:
Nesta escala de tempo está apresentado um gráfico de 1982 ano até 2016 ano Mongolia. Dados de 1981 ano ausente. O número de observações reais por data: 35.
Fonte (nome):
Indicadores de desenvolvimento mundial
Fonte (organização):
Estimates based on sources and methods described in "The Changing Wealth of Nations: Measuring Sustainable Development in the New Millennium" (World Bank, 2011).
Categorias:
Environment
Foi atualizado:
23 abr 2017 ano
Indicadores de alterações dos valores ao longo dos anos
Mínimo:
0.194
1 jan 2014 ano
Máximo:
2.776
1 jan 1983 ano
Na data de observação
Valor
Mudança absoluta
A alteração em relação ao valor anterior
1 jan 1982 ano
1.954
+1.954
0.0%
1 jan 1983 ano
2.776
+0.822
42.08%
1 jan 1984 ano
1.269
-1.507
-54.29%
1 jan 1985 ano
1.2
-0.069
-5.41%
1 jan 1986 ano
1.661
+0.461
38.45%
1 jan 1987 ano
1.216
-0.445
-26.78%
1 jan 1988 ano
0.978
-0.239
-19.62%
1 jan 1989 ano
0.849
-0.129
-13.14%
1 jan 1990 ano
0.833
-0.016
-1.92%
1 jan 1991 ano
1.032
+0.199
23.9%
1 jan 1992 ano
0.784
-0.248
-24.05%
1 jan 1993 ano
1.303
+0.519
66.24%
1 jan 1994 ano
2.552
+1.249
95.85%
1 jan 1995 ano
1.849
-0.703
-27.56%
1 jan 1996 ano
1.226
-0.623
-33.67%
1 jan 1997 ano
1.341
+0.114
9.32%
1 jan 1998 ano
1.323
-0.018
-1.36%
1 jan 1999 ano
1.208
-0.115
-8.68%
1 jan 2000 ano
0.985
-0.223
-18.44%
1 jan 2001 ano
0.55
-0.435
-44.19%
1 jan 2002 ano
0.596
+0.046
8.35%
1 jan 2003 ano
0.602
+0.006
1.07%
1 jan 2004 ano
0.765
+0.163
27.1%
1 jan 2005 ano
0.682
-0.083
-10.85%
1 jan 2006 ano
0.364
-0.319
-46.72%
1 jan 2007 ano
0.33
-0.033
-9.17%
1 jan 2008 ano
0.397
+0.067
20.34%
1 jan 2009 ano
0.501
+0.104
26.2%
1 jan 2010 ano
0.586
+0.085
16.89%
1 jan 2011 ano
0.37
-0.216
-36.88%
1 jan 2012 ano
0.34
-0.03
-8.06%
1 jan 2013 ano
0.229
-0.111
-32.75%
1 jan 2014 ano
0.194
-0.034
-15.01%
1 jan 2015 ano
0.27
+0.076
39.13%
1 jan 2016 ano
0.247
-0.024
-8.74%
Classificação de países por estatísticas atuais por anos


Comentários: