29
/pt/
pt
AIzaSyAYiBZKx7MnpbEhh9jyipgxe19OcubqV5w
April 1, 2024
133131
Finland
FIN
true
2
1
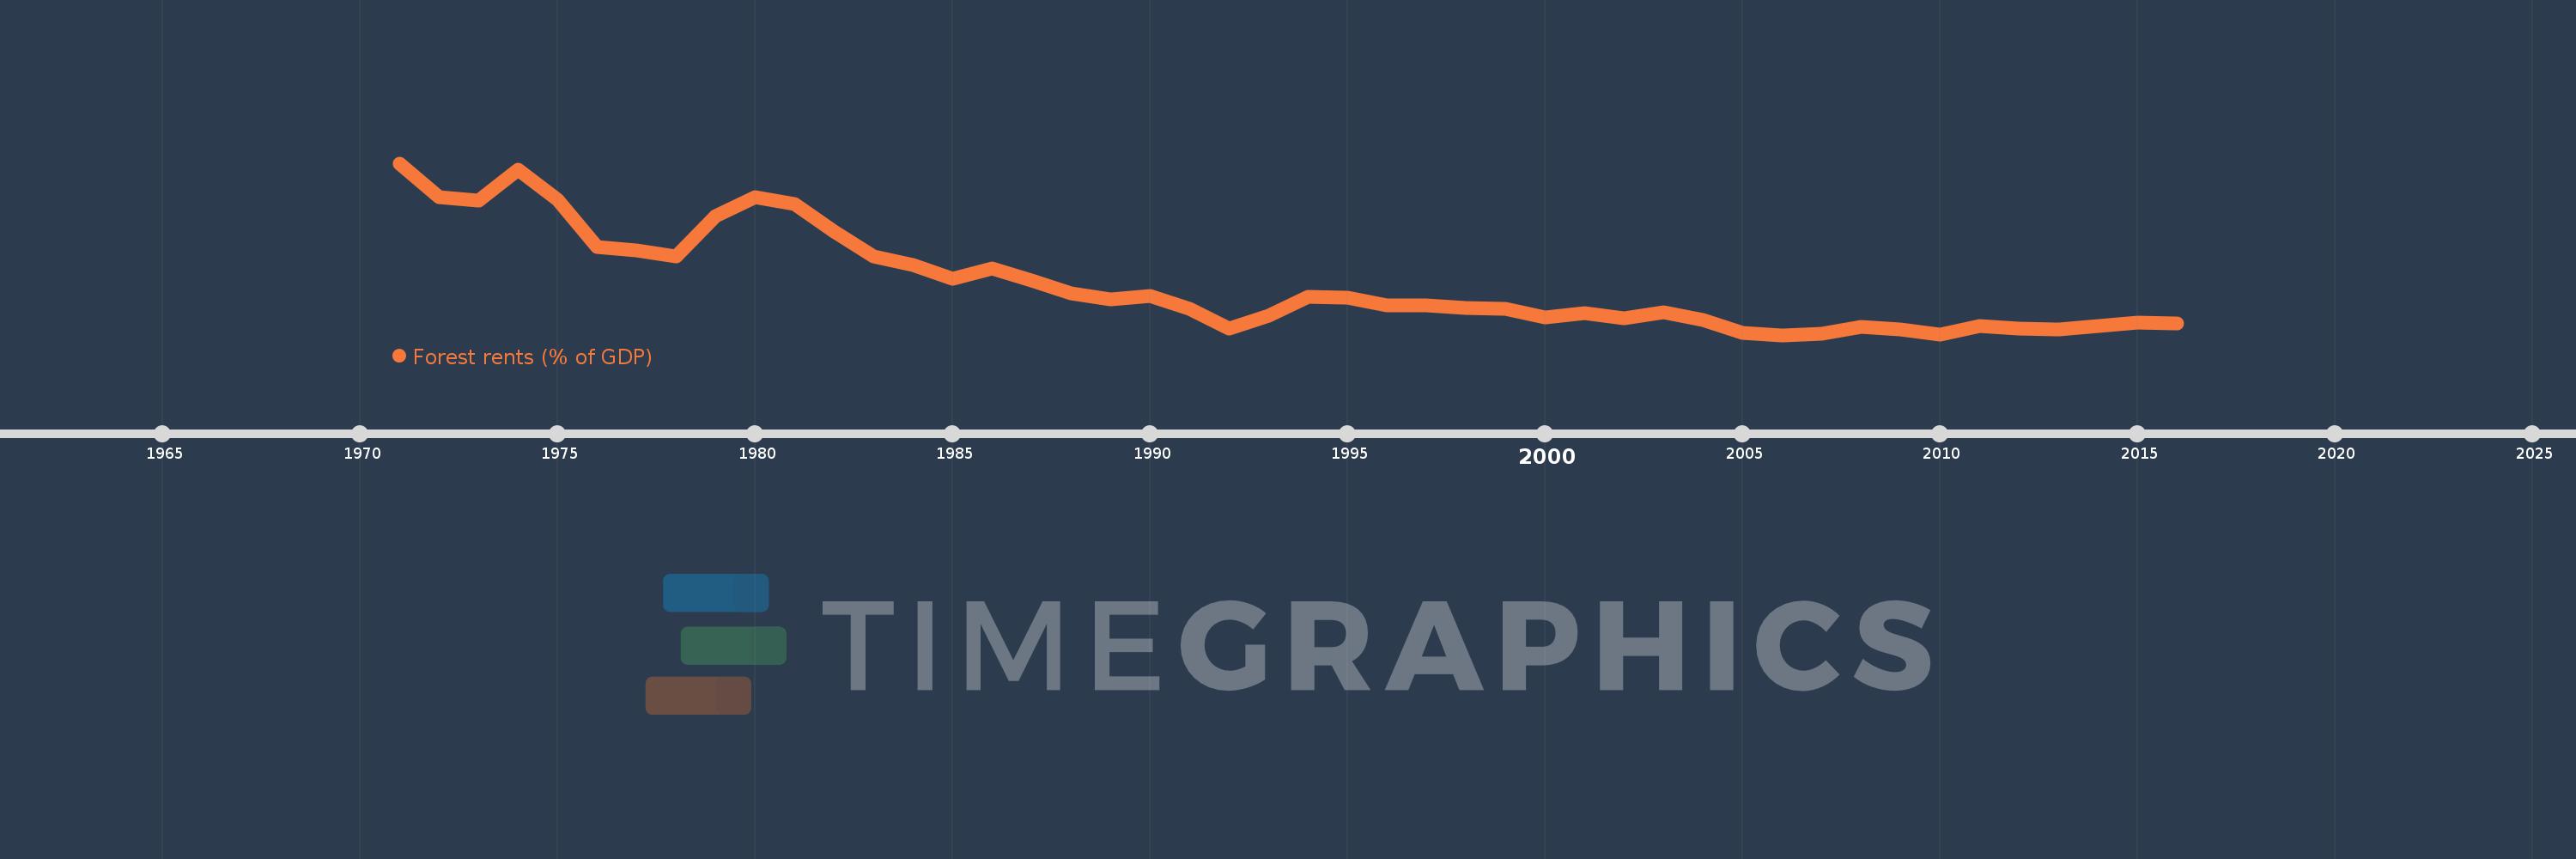
Forest rents (% of GDP)
2016,2015,2014,2013,2012,2011,2010,2009,2008,2007,2006,2005,2004,2003,2002,2001,2000,1999,1998,1997,1996,1995,1994,1993,1992,1991,1990,1989,1988,1987,1986,1985,1984,1983,1982,1981,1980,1979,1978,1977,1976,1975,1974,1973,1972,1971
Estas estatísticas em outros países:
AfghanistanAlbaniaAlgeriaAndorraAngolaArab WorldArgentinaArmeniaArubaAustraliaAustriaAzerbaijanBahamas, TheBahrainBangladeshBarbadosBelarusBelgiumBelizeBeninBhutanBoliviaBosnia and HerzegovinaBotswanaBrazilBrunei DarussalamBulgariaBurkina FasoBurundiCabo VerdeCambodiaCameroonCanadaCaribbean small statesCentral African RepublicCentral Europe and the BalticsChadChileChinaColombiaComorosCongo, Dem. Rep.Congo, Rep.Costa RicaCote d'IvoireCroatiaCubaCyprusCzech RepublicDenmarkDjiboutiDominicaDominican RepublicEarly-demographic dividendEast Asia & PacificEast Asia & Pacific (excluding high income)East Asia & Pacific (IDA & IBRD countries)EcuadorEgypt, Arab Rep.El SalvadorEquatorial GuineaEritreaEstoniaEthiopiaEuro areaEurope & Central AsiaEurope & Central Asia (excluding high income)Europe & Central Asia (IDA & IBRD countries)European UnionFaroe IslandsFijiFinlandFragile and conflict affected situationsFranceFrench PolynesiaGabonGambia, TheGeorgiaGermanyGhanaGreeceGuatemalaGuineaGuinea-BissauGuyanaHaitiHeavily indebted poor countries (HIPC)High incomeHondurasHong Kong SAR, ChinaHungaryIBRD onlyIcelandIDA & IBRD totalIDA blendIDA onlyIDA totalIndiaIndonesiaIran, Islamic Rep.IraqIrelandIsraelItalyJamaicaJapanJordanKazakhstanKenyaKiribatiKorea, Rep.KuwaitKyrgyz RepublicLao PDRLate-demographic dividendLatin America & Caribbean Latin America & Caribbean (excluding high income)Latin America & the Caribbean (IDA & IBRD countries)LatviaLeast developed countries: UN classificationLebanonLesothoLiberiaLibyaLiechtensteinLithuaniaLow & middle incomeLow incomeLower middle incomeLuxembourgMacao SAR, ChinaMacedonia, FYRMadagascarMalawiMalaysiaMaldivesMaliMaltaMauritaniaMauritiusMexicoMicronesia, Fed. Sts.Middle East & North AfricaMiddle East & North Africa (excluding high income)Middle East & North Africa (IDA & IBRD countries)Middle incomeMoldovaMongoliaMontenegroMoroccoMozambiqueMyanmarNamibiaNepalNetherlandsNew CaledoniaNew ZealandNicaraguaNigerNigeriaNorth AmericaNorwayOECD membersOmanOther small statesPacific island small statesPakistanPanamaPapua New GuineaParaguayPeruPhilippinesPolandPortugalPost-demographic dividendPre-demographic dividendQatarRomaniaRussian FederationRwandaSamoaSao Tome and PrincipeSaudi ArabiaSenegalSerbiaSeychellesSierra LeoneSingaporeSlovak RepublicSloveniaSmall statesSolomon IslandsSomaliaSouth AfricaSouth AsiaSouth Asia (IDA & IBRD)South SudanSpainSri LankaSt. LuciaSt. Vincent and the GrenadinesSub-Saharan Africa Sub-Saharan Africa (excluding high income)Sub-Saharan Africa (IDA & IBRD countries)SudanSurinameSwazilandSwedenSwitzerlandSyrian Arab RepublicTajikistanTanzaniaThailandTimor-LesteTogoTongaTrinidad and TobagoTunisiaTurkeyTurkmenistanUgandaUkraineUnited Arab EmiratesUnited KingdomUnited StatesUpper middle incomeUruguayUzbekistanVanuatuVenezuela, RBVietnamWorldYemen, Rep.ZambiaZimbabwe Linha do tempo:
Nesta escala de tempo está apresentado um gráfico de 1971 ano até 2016 ano Finland. Dados de 1970 ano ausente. O número de observações reais por data: 46.
Fonte (nome):
Indicadores de desenvolvimento mundial
Fonte (organização):
Estimates based on sources and methods described in "The Changing Wealth of Nations: Measuring Sustainable Development in the New Millennium" (World Bank, 2011).
Categorias:
Environment
Foi atualizado:
23 abr 2017 ano
Indicadores de alterações dos valores ao longo dos anos
Mínimo:
0.251
1 jan 2006 ano
Máximo:
1.465
1 jan 1971 ano
Na data de observação
Valor
Mudança absoluta
A alteração em relação ao valor anterior
1 jan 1971 ano
1.465
+1.465
0.0%
1 jan 1972 ano
1.225
-0.239
-16.34%
1 jan 1973 ano
1.2
-0.025
-2.02%
1 jan 1974 ano
1.419
+0.218
18.2%
1 jan 1975 ano
1.206
-0.212
-14.97%
1 jan 1976 ano
0.872
-0.334
-27.71%
1 jan 1977 ano
0.849
-0.023
-2.6%
1 jan 1978 ano
0.805
-0.044
-5.23%
1 jan 1979 ano
1.093
+0.288
35.73%
1 jan 1980 ano
1.226
+0.134
12.23%
1 jan 1981 ano
1.179
-0.047
-3.83%
1 jan 1982 ano
0.98
-0.199
-16.87%
1 jan 1983 ano
0.808
-0.173
-17.61%
1 jan 1984 ano
0.745
-0.063
-7.82%
1 jan 1985 ano
0.647
-0.098
-13.16%
1 jan 1986 ano
0.724
+0.077
11.91%
1 jan 1987 ano
0.634
-0.09
-12.44%
1 jan 1988 ano
0.548
-0.086
-13.54%
1 jan 1989 ano
0.505
-0.043
-7.78%
1 jan 1990 ano
0.53
+0.025
5.0%
1 jan 1991 ano
0.439
-0.092
-17.27%
1 jan 1992 ano
0.298
-0.141
-32.07%
1 jan 1993 ano
0.386
+0.088
29.63%
1 jan 1994 ano
0.522
+0.136
35.14%
1 jan 1995 ano
0.516
-0.006
-1.11%
1 jan 1996 ano
0.461
-0.056
-10.79%
1 jan 1997 ano
0.46
-0.001
-0.17%
1 jan 1998 ano
0.441
-0.018
-3.99%
1 jan 1999 ano
0.436
-0.005
-1.22%
1 jan 2000 ano
0.377
-0.059
-13.61%
1 jan 2001 ano
0.406
+0.03
7.85%
1 jan 2002 ano
0.37
-0.037
-8.99%
1 jan 2003 ano
0.412
+0.042
11.31%
1 jan 2004 ano
0.359
-0.052
-12.7%
1 jan 2005 ano
0.267
-0.092
-25.72%
1 jan 2006 ano
0.251
-0.016
-5.94%
1 jan 2007 ano
0.259
+0.008
3.14%
1 jan 2008 ano
0.308
+0.049
18.79%
1 jan 2009 ano
0.289
-0.018
-5.97%
1 jan 2010 ano
0.252
-0.037
-12.93%
1 jan 2011 ano
0.316
+0.064
25.39%
1 jan 2012 ano
0.295
-0.021
-6.5%
1 jan 2013 ano
0.292
-0.003
-1.11%
1 jan 2014 ano
0.316
+0.024
8.36%
1 jan 2015 ano
0.336
+0.019
6.07%
1 jan 2016 ano
0.33
-0.006
-1.68%
Classificação de países por estatísticas atuais por anos


Comentários: