29
/pt/
pt
AIzaSyAYiBZKx7MnpbEhh9jyipgxe19OcubqV5w
April 1, 2024
131981
Fiji
FJI
true
2
1
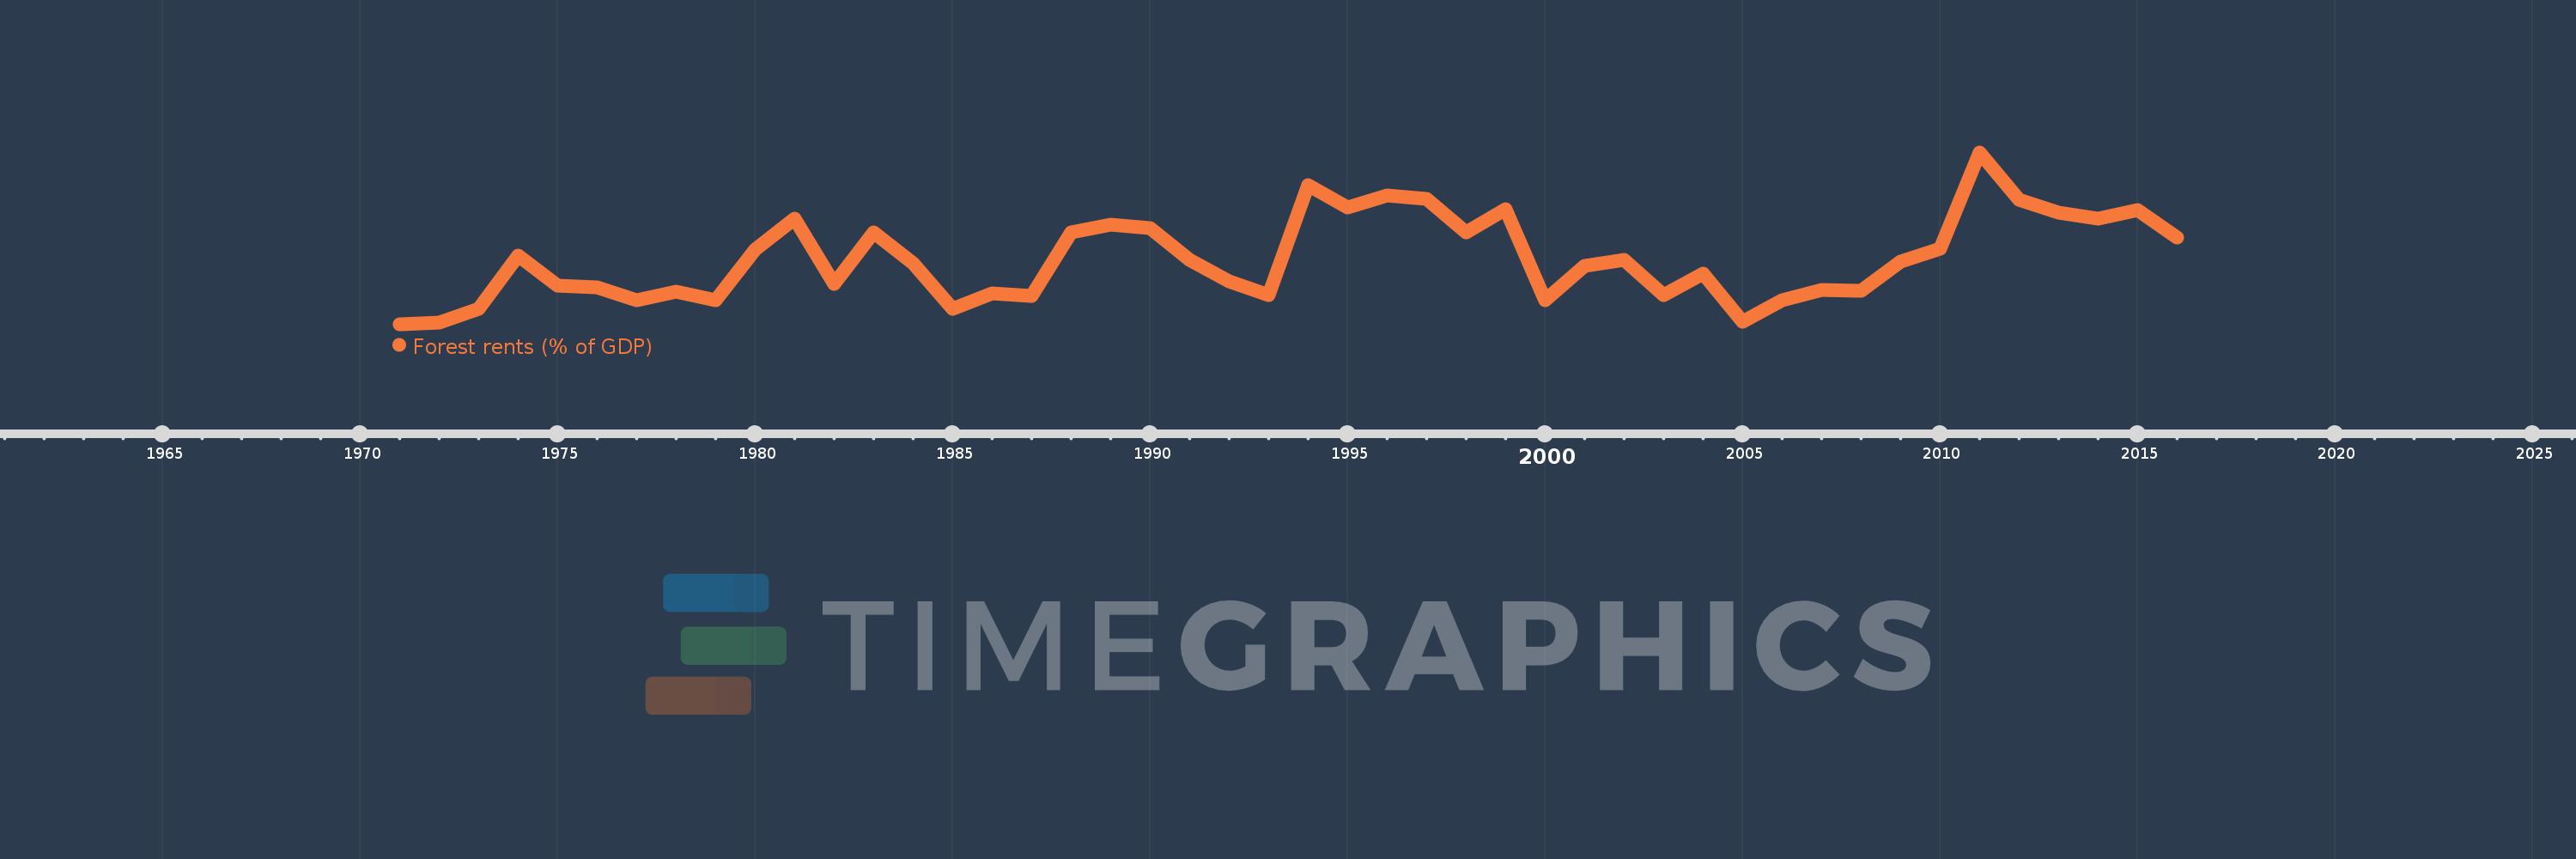
Forest rents (% of GDP)
2016,2015,2014,2013,2012,2011,2010,2009,2008,2007,2006,2005,2004,2003,2002,2001,2000,1999,1998,1997,1996,1995,1994,1993,1992,1991,1990,1989,1988,1987,1986,1985,1984,1983,1982,1981,1980,1979,1978,1977,1976,1975,1974,1973,1972,1971
Estas estatísticas em outros países:
AfghanistanAlbaniaAlgeriaAndorraAngolaArab WorldArgentinaArmeniaArubaAustraliaAustriaAzerbaijanBahamas, TheBahrainBangladeshBarbadosBelarusBelgiumBelizeBeninBhutanBoliviaBosnia and HerzegovinaBotswanaBrazilBrunei DarussalamBulgariaBurkina FasoBurundiCabo VerdeCambodiaCameroonCanadaCaribbean small statesCentral African RepublicCentral Europe and the BalticsChadChileChinaColombiaComorosCongo, Dem. Rep.Congo, Rep.Costa RicaCote d'IvoireCroatiaCubaCyprusCzech RepublicDenmarkDjiboutiDominicaDominican RepublicEarly-demographic dividendEast Asia & PacificEast Asia & Pacific (excluding high income)East Asia & Pacific (IDA & IBRD countries)EcuadorEgypt, Arab Rep.El SalvadorEquatorial GuineaEritreaEstoniaEthiopiaEuro areaEurope & Central AsiaEurope & Central Asia (excluding high income)Europe & Central Asia (IDA & IBRD countries)European UnionFaroe IslandsFijiFinlandFragile and conflict affected situationsFranceFrench PolynesiaGabonGambia, TheGeorgiaGermanyGhanaGreeceGuatemalaGuineaGuinea-BissauGuyanaHaitiHeavily indebted poor countries (HIPC)High incomeHondurasHong Kong SAR, ChinaHungaryIBRD onlyIcelandIDA & IBRD totalIDA blendIDA onlyIDA totalIndiaIndonesiaIran, Islamic Rep.IraqIrelandIsraelItalyJamaicaJapanJordanKazakhstanKenyaKiribatiKorea, Rep.KuwaitKyrgyz RepublicLao PDRLate-demographic dividendLatin America & Caribbean Latin America & Caribbean (excluding high income)Latin America & the Caribbean (IDA & IBRD countries)LatviaLeast developed countries: UN classificationLebanonLesothoLiberiaLibyaLiechtensteinLithuaniaLow & middle incomeLow incomeLower middle incomeLuxembourgMacao SAR, ChinaMacedonia, FYRMadagascarMalawiMalaysiaMaldivesMaliMaltaMauritaniaMauritiusMexicoMicronesia, Fed. Sts.Middle East & North AfricaMiddle East & North Africa (excluding high income)Middle East & North Africa (IDA & IBRD countries)Middle incomeMoldovaMongoliaMontenegroMoroccoMozambiqueMyanmarNamibiaNepalNetherlandsNew CaledoniaNew ZealandNicaraguaNigerNigeriaNorth AmericaNorwayOECD membersOmanOther small statesPacific island small statesPakistanPanamaPapua New GuineaParaguayPeruPhilippinesPolandPortugalPost-demographic dividendPre-demographic dividendQatarRomaniaRussian FederationRwandaSamoaSao Tome and PrincipeSaudi ArabiaSenegalSerbiaSeychellesSierra LeoneSingaporeSlovak RepublicSloveniaSmall statesSolomon IslandsSomaliaSouth AfricaSouth AsiaSouth Asia (IDA & IBRD)South SudanSpainSri LankaSt. LuciaSt. Vincent and the GrenadinesSub-Saharan Africa Sub-Saharan Africa (excluding high income)Sub-Saharan Africa (IDA & IBRD countries)SudanSurinameSwazilandSwedenSwitzerlandSyrian Arab RepublicTajikistanTanzaniaThailandTimor-LesteTogoTongaTrinidad and TobagoTunisiaTurkeyTurkmenistanUgandaUkraineUnited Arab EmiratesUnited KingdomUnited StatesUpper middle incomeUruguayUzbekistanVanuatuVenezuela, RBVietnamWorldYemen, Rep.ZambiaZimbabwe Linha do tempo:
Nesta escala de tempo está apresentado um gráfico de 1971 ano até 2016 ano Fiji. Dados de 1970 ano ausente. O número de observações reais por data: 46.
Fonte (nome):
Indicadores de desenvolvimento mundial
Fonte (organização):
Estimates based on sources and methods described in "The Changing Wealth of Nations: Measuring Sustainable Development in the New Millennium" (World Bank, 2011).
Categorias:
Environment
Foi atualizado:
23 abr 2017 ano
Indicadores de alterações dos valores ao longo dos anos
Mínimo:
0.341
1 jan 1971 ano
Máximo:
1.105
1 jan 2011 ano
Na data de observação
Valor
Mudança absoluta
A alteração em relação ao valor anterior
1 jan 1971 ano
0.341
+0.341
0.0%
1 jan 1972 ano
0.348
+0.006
1.8%
1 jan 1973 ano
0.411
+0.064
18.33%
1 jan 1974 ano
0.646
+0.235
57.08%
1 jan 1975 ano
0.512
-0.134
-20.81%
1 jan 1976 ano
0.506
-0.006
-1.14%
1 jan 1977 ano
0.449
-0.057
-11.23%
1 jan 1978 ano
0.486
+0.037
8.19%
1 jan 1979 ano
0.447
-0.038
-7.87%
1 jan 1980 ano
0.672
+0.224
50.09%
1 jan 1981 ano
0.81
+0.138
20.54%
1 jan 1982 ano
0.519
-0.291
-35.89%
1 jan 1983 ano
0.751
+0.232
44.7%
1 jan 1984 ano
0.611
-0.14
-18.62%
1 jan 1985 ano
0.408
-0.203
-33.19%
1 jan 1986 ano
0.48
+0.072
17.56%
1 jan 1987 ano
0.468
-0.012
-2.6%
1 jan 1988 ano
0.749
+0.281
60.15%
1 jan 1989 ano
0.782
+0.034
4.49%
1 jan 1990 ano
0.767
-0.016
-2.03%
1 jan 1991 ano
0.627
-0.14
-18.2%
1 jan 1992 ano
0.532
-0.095
-15.21%
1 jan 1993 ano
0.469
-0.062
-11.74%
1 jan 1994 ano
0.959
+0.49
104.33%
1 jan 1995 ano
0.861
-0.098
-10.2%
1 jan 1996 ano
0.915
+0.053
6.21%
1 jan 1997 ano
0.898
-0.016
-1.8%
1 jan 1998 ano
0.75
-0.148
-16.43%
1 jan 1999 ano
0.853
+0.102
13.64%
1 jan 2000 ano
0.448
-0.405
-47.49%
1 jan 2001 ano
0.602
+0.154
34.34%
1 jan 2002 ano
0.626
+0.025
4.11%
1 jan 2003 ano
0.47
-0.157
-25.02%
1 jan 2004 ano
0.566
+0.097
20.6%
1 jan 2005 ano
0.353
-0.213
-37.63%
1 jan 2006 ano
0.449
+0.096
27.15%
1 jan 2007 ano
0.494
+0.045
10.0%
1 jan 2008 ano
0.491
-0.003
-0.64%
1 jan 2009 ano
0.621
+0.13
26.53%
1 jan 2010 ano
0.678
+0.057
9.13%
1 jan 2011 ano
1.105
+0.427
62.97%
1 jan 2012 ano
0.895
-0.21
-18.99%
1 jan 2013 ano
0.839
-0.056
-6.24%
1 jan 2014 ano
0.809
-0.03
-3.63%
1 jan 2015 ano
0.85
+0.041
5.06%
1 jan 2016 ano
0.726
-0.123
-14.51%
Classificação de países por estatísticas atuais por anos


Comentários: