29
/pt/
pt
AIzaSyAYiBZKx7MnpbEhh9jyipgxe19OcubqV5w
April 1, 2024
85345
Bermuda
BMU
true
2
1
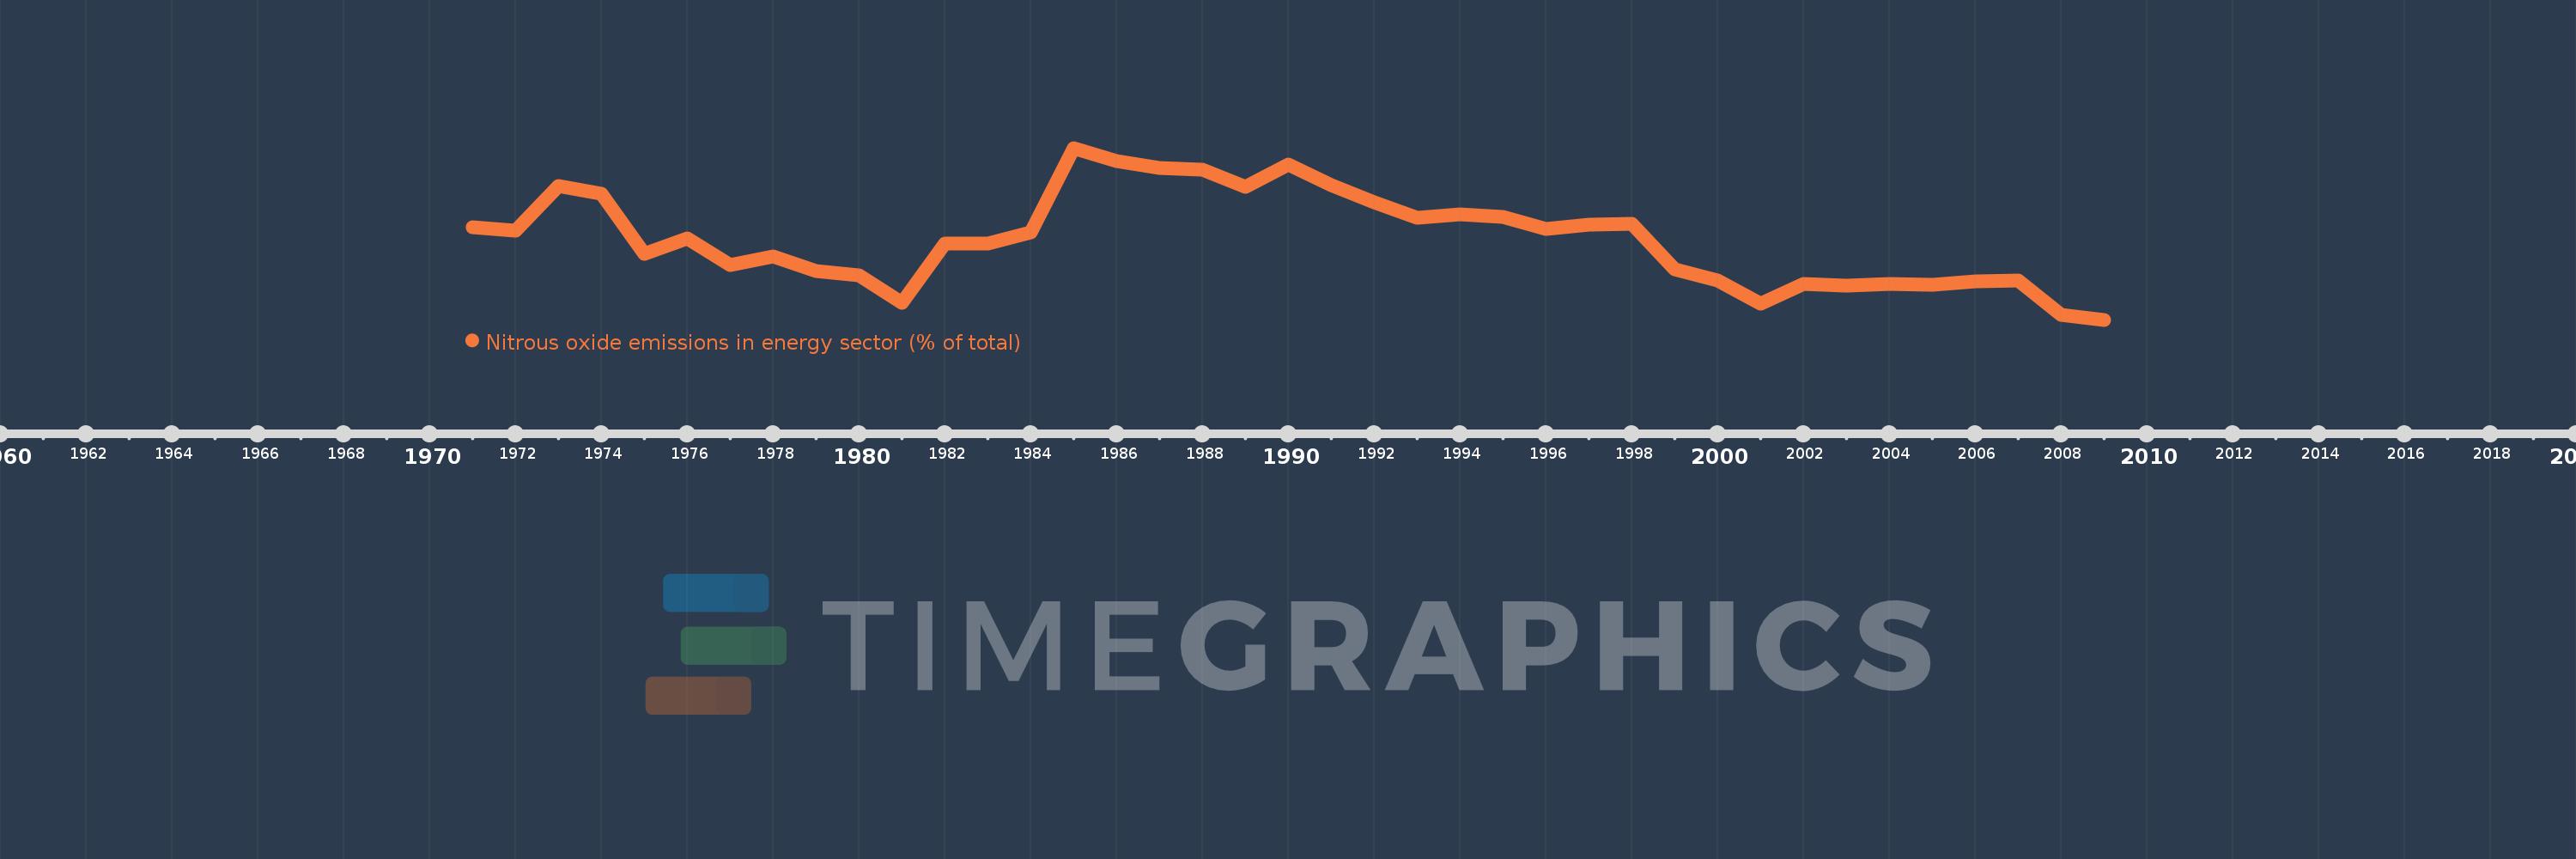
Nitrous oxide emissions in energy sector (% of total)
2009,2008,2007,2006,2005,2004,2003,2002,2001,2000,1999,1998,1997,1996,1995,1994,1993,1992,1991,1990,1989,1988,1987,1986,1985,1984,1983,1982,1981,1980,1979,1978,1977,1976,1975,1974,1973,1972,1971
Estas estatísticas em outros países:
AfghanistanAlbaniaAlgeriaAmerican SamoaAndorraAngolaAntigua and BarbudaArab WorldArgentinaArmeniaArubaAustraliaAustriaAzerbaijanBahamas, TheBahrainBangladeshBarbadosBelarusBelgiumBelizeBeninBermudaBhutanBoliviaBosnia and HerzegovinaBotswanaBrazilBritish Virgin IslandsBrunei DarussalamBulgariaBurkina FasoBurundiCabo VerdeCambodiaCameroonCanadaCaribbean small statesCayman IslandsCentral African RepublicCentral Europe and the BalticsChadChileChinaColombiaComorosCongo, Dem. Rep.Congo, Rep.Costa RicaCote d'IvoireCroatiaCubaCyprusCzech RepublicDenmarkDjiboutiDominicaDominican RepublicEarly-demographic dividendEast Asia & PacificEast Asia & Pacific (excluding high income)East Asia & Pacific (IDA & IBRD countries)EcuadorEgypt, Arab Rep.El SalvadorEquatorial GuineaEritreaEstoniaEthiopiaEuro areaEurope & Central AsiaEurope & Central Asia (excluding high income)Europe & Central Asia (IDA & IBRD countries)European UnionFaroe IslandsFijiFinlandFragile and conflict affected situationsFranceFrench PolynesiaGabonGambia, TheGeorgiaGermanyGhanaGibraltarGreeceGreenlandGrenadaGuamGuatemalaGuineaGuinea-BissauGuyanaHaitiHeavily indebted poor countries (HIPC)High incomeHondurasHong Kong SAR, ChinaHungaryIBRD onlyIcelandIDA & IBRD totalIDA blendIDA onlyIDA totalIndiaIndonesiaIran, Islamic Rep.IraqIrelandIsraelItalyJamaicaJapanJordanKazakhstanKenyaKiribatiKorea, Dem. People’s Rep.Korea, Rep.KuwaitKyrgyz RepublicLao PDRLate-demographic dividendLatin America & Caribbean Latin America & Caribbean (excluding high income)Latin America & the Caribbean (IDA & IBRD countries)LatviaLeast developed countries: UN classificationLebanonLesothoLiberiaLibyaLithuaniaLow & middle incomeLow incomeLower middle incomeLuxembourgMacao SAR, ChinaMacedonia, FYRMadagascarMalawiMalaysiaMaldivesMaliMaltaMarshall IslandsMauritaniaMauritiusMexicoMicronesia, Fed. Sts.Middle East & North AfricaMiddle East & North Africa (excluding high income)Middle East & North Africa (IDA & IBRD countries)Middle incomeMoldovaMongoliaMoroccoMozambiqueMyanmarNamibiaNauruNepalNetherlandsNew CaledoniaNew ZealandNicaraguaNigerNigeriaNorth AmericaNorthern Mariana IslandsNorwayOECD membersOmanOther small statesPacific island small statesPakistanPalauPanamaPapua New GuineaParaguayPeruPhilippinesPolandPortugalPost-demographic dividendPre-demographic dividendPuerto RicoQatarRomaniaRussian FederationRwandaSamoaSao Tome and PrincipeSaudi ArabiaSenegalSerbiaSeychellesSierra LeoneSingaporeSlovak RepublicSloveniaSmall statesSolomon IslandsSomaliaSouth AfricaSouth AsiaSouth Asia (IDA & IBRD)SpainSri LankaSt. Kitts and NevisSt. LuciaSt. Vincent and the GrenadinesSub-Saharan Africa Sub-Saharan Africa (excluding high income)Sub-Saharan Africa (IDA & IBRD countries)SudanSurinameSwazilandSwedenSwitzerlandSyrian Arab RepublicTajikistanTanzaniaThailandTimor-LesteTogoTongaTrinidad and TobagoTunisiaTurkeyTurkmenistanTurks and Caicos IslandsTuvaluUgandaUkraineUnited Arab EmiratesUnited KingdomUnited StatesUpper middle incomeUruguayUzbekistanVanuatuVenezuela, RBVietnamVirgin Islands (U.S.)WorldYemen, Rep.ZambiaZimbabwe Linha do tempo:
Nesta escala de tempo está apresentado um gráfico de 1971 ano até 2009 ano Bermuda. Dados de 1970 ano ausente. O número de observações reais por data: 39.
Fonte (nome):
Indicadores de desenvolvimento mundial
Fonte (organização):
World Bank staff estimates from original source: European Commission, Joint Research Centre (JRC)/Netherlands Environmental Assessment Agency (PBL). Emission Database for Global Atmospheric Research (EDGAR): http://edgar.jrc.ec.europa.eu/.
Categorias:
Energy & Mining, Environment
Foi atualizado:
23 abr 2017 ano
Indicadores de alterações dos valores ao longo dos anos
Mínimo:
16.613
1 jan 2009 ano
Máximo:
28.748
1 jan 1985 ano
Na data de observação
Valor
Mudança absoluta
A alteração em relação ao valor anterior
1 jan 1971 ano
23.175
+23.175
0.0%
1 jan 1972 ano
22.931
-0.244
-1.05%
1 jan 1973 ano
26.088
+3.158
13.77%
1 jan 1974 ano
25.505
-0.583
-2.23%
1 jan 1975 ano
21.285
-4.221
-16.55%
1 jan 1976 ano
22.369
+1.084
5.09%
1 jan 1977 ano
20.481
-1.887
-8.44%
1 jan 1978 ano
21.062
+0.581
2.84%
1 jan 1979 ano
20.038
-1.024
-4.86%
1 jan 1980 ano
19.739
-0.3
-1.5%
1 jan 1981 ano
17.825
-1.914
-9.7%
1 jan 1982 ano
22.002
+4.178
23.44%
1 jan 1983 ano
22.019
+0.017
0.08%
1 jan 1984 ano
22.77
+0.751
3.41%
1 jan 1985 ano
28.748
+5.978
26.25%
1 jan 1986 ano
27.85
-0.898
-3.13%
1 jan 1987 ano
27.347
-0.503
-1.8%
1 jan 1988 ano
27.214
-0.133
-0.49%
1 jan 1989 ano
25.97
-1.244
-4.57%
1 jan 1990 ano
27.569
+1.599
6.16%
1 jan 1991 ano
26.126
-1.442
-5.23%
1 jan 1992 ano
24.897
-1.229
-4.7%
1 jan 1993 ano
23.805
-1.092
-4.39%
1 jan 1994 ano
24.074
+0.269
1.13%
1 jan 1995 ano
23.854
-0.22
-0.92%
1 jan 1996 ano
23.01
-0.844
-3.54%
1 jan 1997 ano
23.324
+0.314
1.36%
1 jan 1998 ano
23.374
+0.05
0.21%
1 jan 1999 ano
20.147
-3.228
-13.81%
1 jan 2000 ano
19.403
-0.744
-3.69%
1 jan 2001 ano
17.754
-1.648
-8.5%
1 jan 2002 ano
19.147
+1.392
7.84%
1 jan 2003 ano
19.002
-0.145
-0.76%
1 jan 2004 ano
19.157
+0.155
0.82%
1 jan 2005 ano
19.077
-0.079
-0.41%
1 jan 2006 ano
19.306
+0.229
1.2%
1 jan 2007 ano
19.412
+0.107
0.55%
1 jan 2008 ano
16.977
-2.435
-12.54%
1 jan 2009 ano
16.613
-0.364
-2.14%
Classificação de países por estatísticas atuais por anos


Comentários: