29
/pt/
pt
AIzaSyAYiBZKx7MnpbEhh9jyipgxe19OcubqV5w
April 1, 2024
161801
Italy
ITA
true
2
1
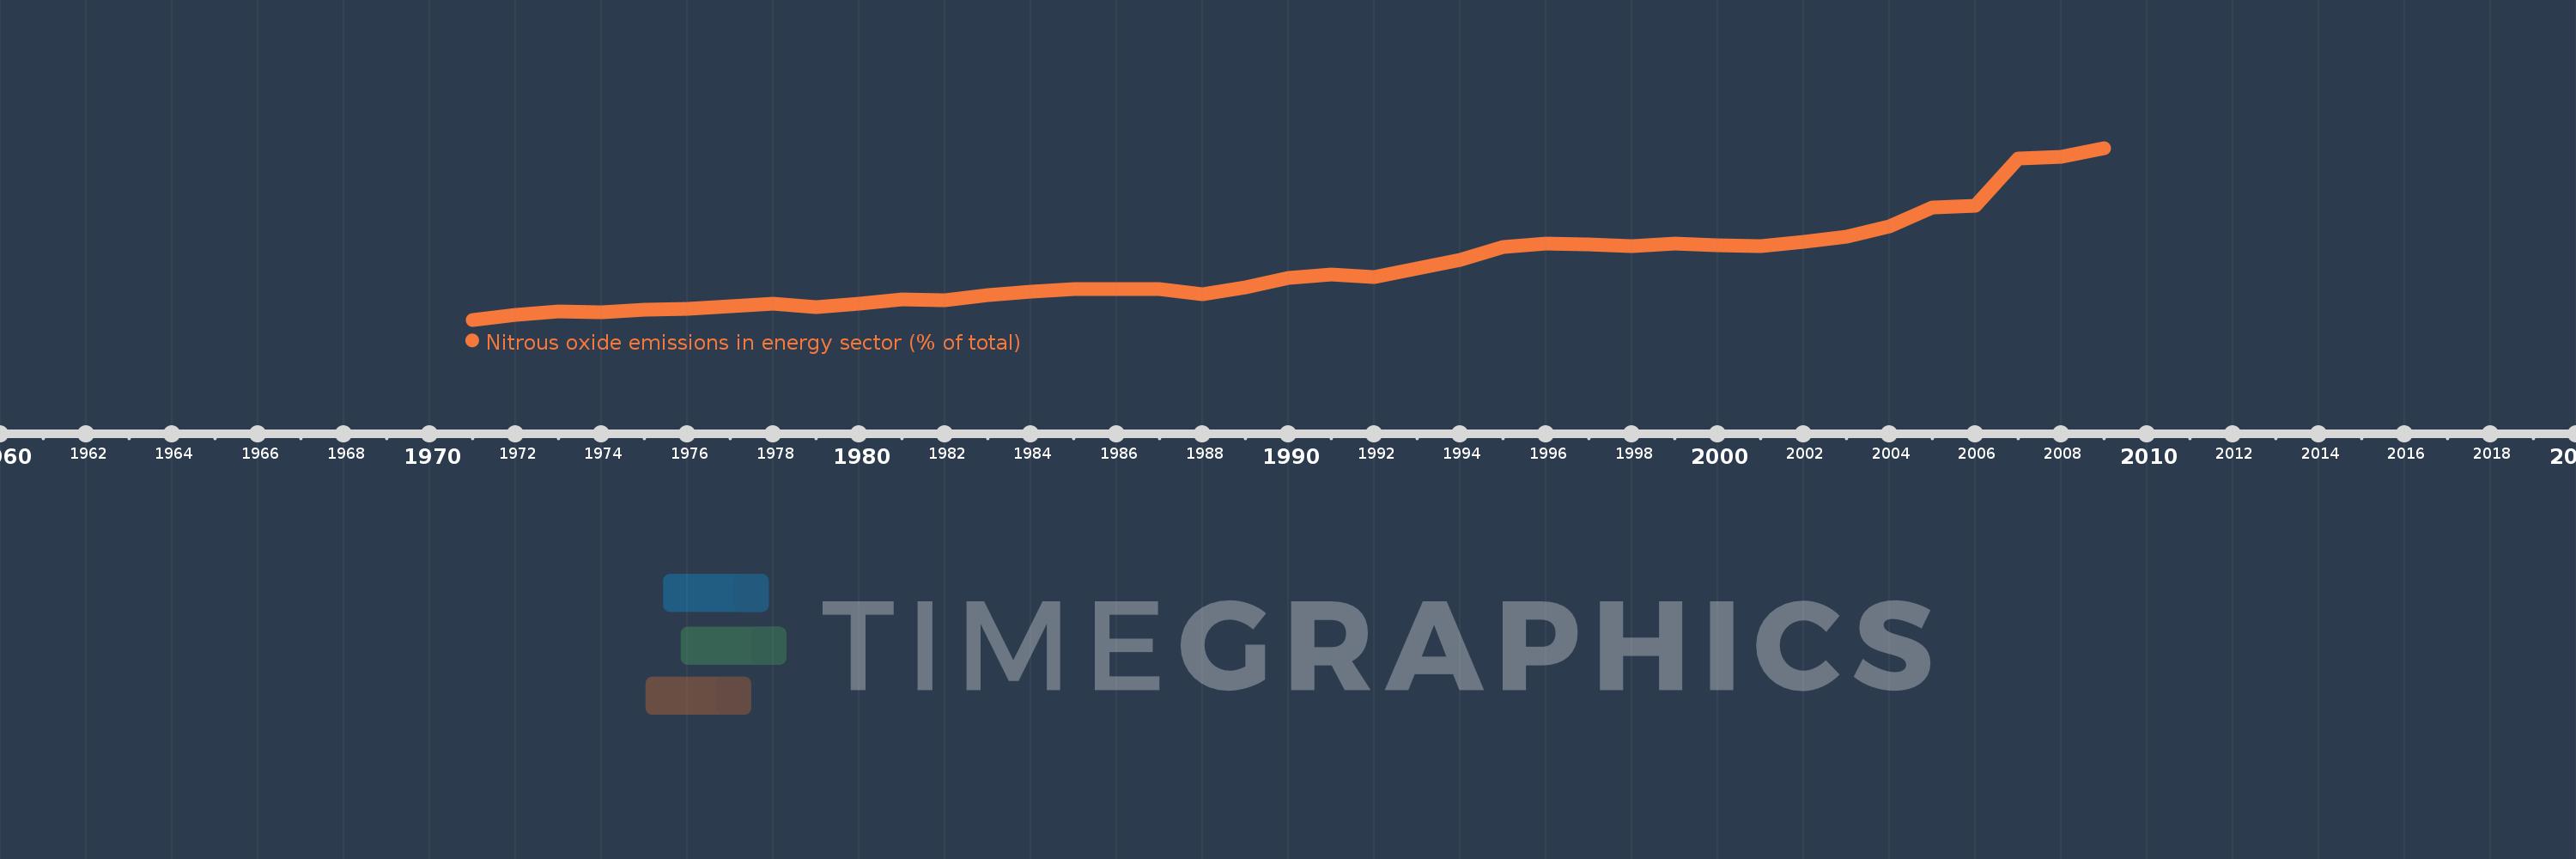
Nitrous oxide emissions in energy sector (% of total)
2009,2008,2007,2006,2005,2004,2003,2002,2001,2000,1999,1998,1997,1996,1995,1994,1993,1992,1991,1990,1989,1988,1987,1986,1985,1984,1983,1982,1981,1980,1979,1978,1977,1976,1975,1974,1973,1972,1971
Estas estatísticas em outros países:
AfghanistanAlbaniaAlgeriaAmerican SamoaAndorraAngolaAntigua and BarbudaArab WorldArgentinaArmeniaArubaAustraliaAustriaAzerbaijanBahamas, TheBahrainBangladeshBarbadosBelarusBelgiumBelizeBeninBermudaBhutanBoliviaBosnia and HerzegovinaBotswanaBrazilBritish Virgin IslandsBrunei DarussalamBulgariaBurkina FasoBurundiCabo VerdeCambodiaCameroonCanadaCaribbean small statesCayman IslandsCentral African RepublicCentral Europe and the BalticsChadChileChinaColombiaComorosCongo, Dem. Rep.Congo, Rep.Costa RicaCote d'IvoireCroatiaCubaCyprusCzech RepublicDenmarkDjiboutiDominicaDominican RepublicEarly-demographic dividendEast Asia & PacificEast Asia & Pacific (excluding high income)East Asia & Pacific (IDA & IBRD countries)EcuadorEgypt, Arab Rep.El SalvadorEquatorial GuineaEritreaEstoniaEthiopiaEuro areaEurope & Central AsiaEurope & Central Asia (excluding high income)Europe & Central Asia (IDA & IBRD countries)European UnionFaroe IslandsFijiFinlandFragile and conflict affected situationsFranceFrench PolynesiaGabonGambia, TheGeorgiaGermanyGhanaGibraltarGreeceGreenlandGrenadaGuamGuatemalaGuineaGuinea-BissauGuyanaHaitiHeavily indebted poor countries (HIPC)High incomeHondurasHong Kong SAR, ChinaHungaryIBRD onlyIcelandIDA & IBRD totalIDA blendIDA onlyIDA totalIndiaIndonesiaIran, Islamic Rep.IraqIrelandIsraelItalyJamaicaJapanJordanKazakhstanKenyaKiribatiKorea, Dem. People’s Rep.Korea, Rep.KuwaitKyrgyz RepublicLao PDRLate-demographic dividendLatin America & Caribbean Latin America & Caribbean (excluding high income)Latin America & the Caribbean (IDA & IBRD countries)LatviaLeast developed countries: UN classificationLebanonLesothoLiberiaLibyaLithuaniaLow & middle incomeLow incomeLower middle incomeLuxembourgMacao SAR, ChinaMacedonia, FYRMadagascarMalawiMalaysiaMaldivesMaliMaltaMarshall IslandsMauritaniaMauritiusMexicoMicronesia, Fed. Sts.Middle East & North AfricaMiddle East & North Africa (excluding high income)Middle East & North Africa (IDA & IBRD countries)Middle incomeMoldovaMongoliaMoroccoMozambiqueMyanmarNamibiaNauruNepalNetherlandsNew CaledoniaNew ZealandNicaraguaNigerNigeriaNorth AmericaNorthern Mariana IslandsNorwayOECD membersOmanOther small statesPacific island small statesPakistanPalauPanamaPapua New GuineaParaguayPeruPhilippinesPolandPortugalPost-demographic dividendPre-demographic dividendPuerto RicoQatarRomaniaRussian FederationRwandaSamoaSao Tome and PrincipeSaudi ArabiaSenegalSerbiaSeychellesSierra LeoneSingaporeSlovak RepublicSloveniaSmall statesSolomon IslandsSomaliaSouth AfricaSouth AsiaSouth Asia (IDA & IBRD)SpainSri LankaSt. Kitts and NevisSt. LuciaSt. Vincent and the GrenadinesSub-Saharan Africa Sub-Saharan Africa (excluding high income)Sub-Saharan Africa (IDA & IBRD countries)SudanSurinameSwazilandSwedenSwitzerlandSyrian Arab RepublicTajikistanTanzaniaThailandTimor-LesteTogoTongaTrinidad and TobagoTunisiaTurkeyTurkmenistanTurks and Caicos IslandsTuvaluUgandaUkraineUnited Arab EmiratesUnited KingdomUnited StatesUpper middle incomeUruguayUzbekistanVanuatuVenezuela, RBVietnamVirgin Islands (U.S.)WorldYemen, Rep.ZambiaZimbabwe Linha do tempo:
Nesta escala de tempo está apresentado um gráfico de 1971 ano até 2009 ano Italy. Dados de 1970 ano ausente. O número de observações reais por data: 39.
Fonte (nome):
Indicadores de desenvolvimento mundial
Fonte (organização):
World Bank staff estimates from original source: European Commission, Joint Research Centre (JRC)/Netherlands Environmental Assessment Agency (PBL). Emission Database for Global Atmospheric Research (EDGAR): http://edgar.jrc.ec.europa.eu/.
Categorias:
Energy & Mining, Environment
Foi atualizado:
23 abr 2017 ano
Indicadores de alterações dos valores ao longo dos anos
Mínimo:
4.749
1 jan 1971 ano
Máximo:
14.865
1 jan 2009 ano
Na data de observação
Valor
Mudança absoluta
A alteração em relação ao valor anterior
1 jan 1971 ano
4.749
+4.749
0.0%
1 jan 1972 ano
5.039
+0.289
6.09%
1 jan 1973 ano
5.244
+0.206
4.08%
1 jan 1974 ano
5.195
-0.049
-0.94%
1 jan 1975 ano
5.335
+0.141
2.71%
1 jan 1976 ano
5.399
+0.064
1.2%
1 jan 1977 ano
5.534
+0.134
2.49%
1 jan 1978 ano
5.717
+0.183
3.31%
1 jan 1979 ano
5.491
-0.225
-3.94%
1 jan 1980 ano
5.708
+0.216
3.94%
1 jan 1981 ano
5.925
+0.218
3.82%
1 jan 1982 ano
5.88
-0.045
-0.76%
1 jan 1983 ano
6.225
+0.345
5.86%
1 jan 1984 ano
6.392
+0.167
2.68%
1 jan 1985 ano
6.54
+0.148
2.32%
1 jan 1986 ano
6.55
+0.01
0.15%
1 jan 1987 ano
6.549
-0.001
-0.02%
1 jan 1988 ano
6.27
-0.279
-4.26%
1 jan 1989 ano
6.639
+0.369
5.89%
1 jan 1990 ano
7.223
+0.584
8.8%
1 jan 1991 ano
7.417
+0.194
2.69%
1 jan 1992 ano
7.283
-0.134
-1.81%
1 jan 1993 ano
7.788
+0.505
6.94%
1 jan 1994 ano
8.292
+0.503
6.46%
1 jan 1995 ano
9.041
+0.749
9.03%
1 jan 1996 ano
9.245
+0.204
2.26%
1 jan 1997 ano
9.204
-0.041
-0.44%
1 jan 1998 ano
9.074
-0.131
-1.42%
1 jan 1999 ano
9.217
+0.143
1.58%
1 jan 2000 ano
9.147
-0.071
-0.77%
1 jan 2001 ano
9.074
-0.072
-0.79%
1 jan 2002 ano
9.325
+0.251
2.77%
1 jan 2003 ano
9.623
+0.297
3.19%
1 jan 2004 ano
10.226
+0.604
6.28%
1 jan 2005 ano
11.366
+1.14
11.15%
1 jan 2006 ano
11.484
+0.118
1.04%
1 jan 2007 ano
14.236
+2.751
23.96%
1 jan 2008 ano
14.325
+0.089
0.63%
1 jan 2009 ano
14.865
+0.54
3.77%
Classificação de países por estatísticas atuais por anos


Comentários: