29
/pt/
pt
AIzaSyAYiBZKx7MnpbEhh9jyipgxe19OcubqV5w
April 1, 2024
40199
IDA total
IDA
false
2
1
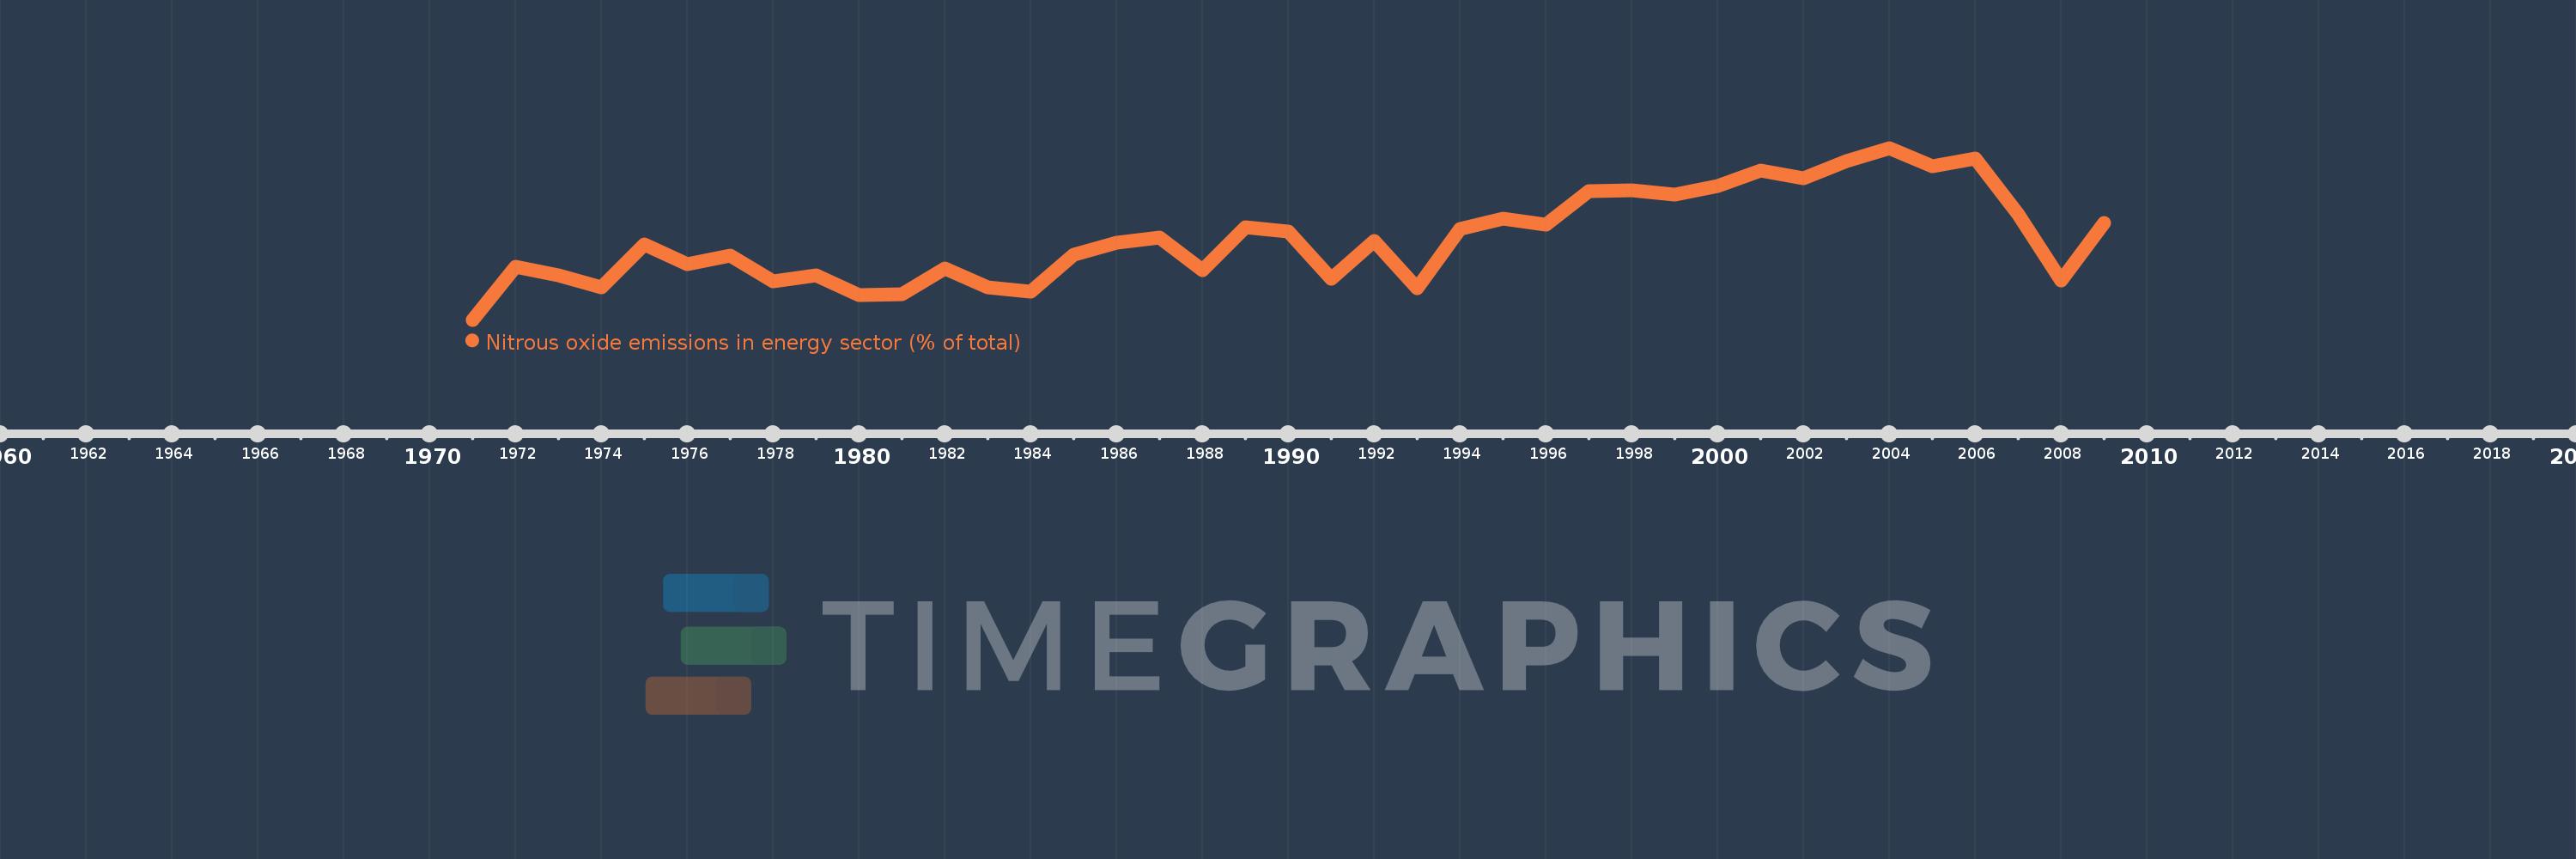
Nitrous oxide emissions in energy sector (% of total)
2009,2008,2007,2006,2005,2004,2003,2002,2001,2000,1999,1998,1997,1996,1995,1994,1993,1992,1991,1990,1989,1988,1987,1986,1985,1984,1983,1982,1981,1980,1979,1978,1977,1976,1975,1974,1973,1972,1971
Estas estatísticas em outros países:
AfghanistanAlbaniaAlgeriaAmerican SamoaAndorraAngolaAntigua and BarbudaArab WorldArgentinaArmeniaArubaAustraliaAustriaAzerbaijanBahamas, TheBahrainBangladeshBarbadosBelarusBelgiumBelizeBeninBermudaBhutanBoliviaBosnia and HerzegovinaBotswanaBrazilBritish Virgin IslandsBrunei DarussalamBulgariaBurkina FasoBurundiCabo VerdeCambodiaCameroonCanadaCaribbean small statesCayman IslandsCentral African RepublicCentral Europe and the BalticsChadChileChinaColombiaComorosCongo, Dem. Rep.Congo, Rep.Costa RicaCote d'IvoireCroatiaCubaCyprusCzech RepublicDenmarkDjiboutiDominicaDominican RepublicEarly-demographic dividendEast Asia & PacificEast Asia & Pacific (excluding high income)East Asia & Pacific (IDA & IBRD countries)EcuadorEgypt, Arab Rep.El SalvadorEquatorial GuineaEritreaEstoniaEthiopiaEuro areaEurope & Central AsiaEurope & Central Asia (excluding high income)Europe & Central Asia (IDA & IBRD countries)European UnionFaroe IslandsFijiFinlandFragile and conflict affected situationsFranceFrench PolynesiaGabonGambia, TheGeorgiaGermanyGhanaGibraltarGreeceGreenlandGrenadaGuamGuatemalaGuineaGuinea-BissauGuyanaHaitiHeavily indebted poor countries (HIPC)High incomeHondurasHong Kong SAR, ChinaHungaryIBRD onlyIcelandIDA & IBRD totalIDA blendIDA onlyIDA totalIndiaIndonesiaIran, Islamic Rep.IraqIrelandIsraelItalyJamaicaJapanJordanKazakhstanKenyaKiribatiKorea, Dem. People’s Rep.Korea, Rep.KuwaitKyrgyz RepublicLao PDRLate-demographic dividendLatin America & Caribbean Latin America & Caribbean (excluding high income)Latin America & the Caribbean (IDA & IBRD countries)LatviaLeast developed countries: UN classificationLebanonLesothoLiberiaLibyaLithuaniaLow & middle incomeLow incomeLower middle incomeLuxembourgMacao SAR, ChinaMacedonia, FYRMadagascarMalawiMalaysiaMaldivesMaliMaltaMarshall IslandsMauritaniaMauritiusMexicoMicronesia, Fed. Sts.Middle East & North AfricaMiddle East & North Africa (excluding high income)Middle East & North Africa (IDA & IBRD countries)Middle incomeMoldovaMongoliaMoroccoMozambiqueMyanmarNamibiaNauruNepalNetherlandsNew CaledoniaNew ZealandNicaraguaNigerNigeriaNorth AmericaNorthern Mariana IslandsNorwayOECD membersOmanOther small statesPacific island small statesPakistanPalauPanamaPapua New GuineaParaguayPeruPhilippinesPolandPortugalPost-demographic dividendPre-demographic dividendPuerto RicoQatarRomaniaRussian FederationRwandaSamoaSao Tome and PrincipeSaudi ArabiaSenegalSerbiaSeychellesSierra LeoneSingaporeSlovak RepublicSloveniaSmall statesSolomon IslandsSomaliaSouth AfricaSouth AsiaSouth Asia (IDA & IBRD)SpainSri LankaSt. Kitts and NevisSt. LuciaSt. Vincent and the GrenadinesSub-Saharan Africa Sub-Saharan Africa (excluding high income)Sub-Saharan Africa (IDA & IBRD countries)SudanSurinameSwazilandSwedenSwitzerlandSyrian Arab RepublicTajikistanTanzaniaThailandTimor-LesteTogoTongaTrinidad and TobagoTunisiaTurkeyTurkmenistanTurks and Caicos IslandsTuvaluUgandaUkraineUnited Arab EmiratesUnited KingdomUnited StatesUpper middle incomeUruguayUzbekistanVanuatuVenezuela, RBVietnamVirgin Islands (U.S.)WorldYemen, Rep.ZambiaZimbabwe Linha do tempo:
Nesta escala de tempo está apresentado um gráfico de 1971 ano até 2009 ano IDA total. Dados de 1970 ano ausente. O número de observações reais por data: 39.
Fonte (nome):
Indicadores de desenvolvimento mundial
Fonte (organização):
World Bank staff estimates from original source: European Commission, Joint Research Centre (JRC)/Netherlands Environmental Assessment Agency (PBL). Emission Database for Global Atmospheric Research (EDGAR): http://edgar.jrc.ec.europa.eu/.
Categorias:
Energy & Mining, Environment
Foi atualizado:
23 abr 2017 ano
Indicadores de alterações dos valores ao longo dos anos
Mínimo:
1.99
1 jan 1971 ano
Máximo:
4.266
1 jan 2004 ano
Na data de observação
Valor
Mudança absoluta
A alteração em relação ao valor anterior
1 jan 1971 ano
1.99
+1.99
0.0%
1 jan 1972 ano
2.693
+0.703
35.33%
1 jan 1973 ano
2.576
-0.117
-4.34%
1 jan 1974 ano
2.42
-0.157
-6.08%
1 jan 1975 ano
2.986
+0.566
23.41%
1 jan 1976 ano
2.728
-0.259
-8.66%
1 jan 1977 ano
2.837
+0.109
3.99%
1 jan 1978 ano
2.498
-0.338
-11.93%
1 jan 1979 ano
2.579
+0.081
3.23%
1 jan 1980 ano
2.312
-0.266
-10.33%
1 jan 1981 ano
2.331
+0.018
0.8%
1 jan 1982 ano
2.67
+0.339
14.54%
1 jan 1983 ano
2.414
-0.255
-9.57%
1 jan 1984 ano
2.366
-0.048
-1.98%
1 jan 1985 ano
2.851
+0.485
20.48%
1 jan 1986 ano
3.009
+0.158
5.54%
1 jan 1987 ano
3.08
+0.071
2.36%
1 jan 1988 ano
2.648
-0.432
-14.04%
1 jan 1989 ano
3.221
+0.574
21.67%
1 jan 1990 ano
3.156
-0.065
-2.03%
1 jan 1991 ano
2.537
-0.619
-19.6%
1 jan 1992 ano
3.032
+0.495
19.5%
1 jan 1993 ano
2.404
-0.628
-20.7%
1 jan 1994 ano
3.198
+0.794
33.03%
1 jan 1995 ano
3.327
+0.128
4.01%
1 jan 1996 ano
3.255
-0.072
-2.15%
1 jan 1997 ano
3.694
+0.439
13.49%
1 jan 1998 ano
3.703
+0.009
0.24%
1 jan 1999 ano
3.643
-0.06
-1.62%
1 jan 2000 ano
3.76
+0.117
3.22%
1 jan 2001 ano
3.971
+0.21
5.59%
1 jan 2002 ano
3.859
-0.111
-2.8%
1 jan 2003 ano
4.094
+0.235
6.09%
1 jan 2004 ano
4.266
+0.171
4.18%
1 jan 2005 ano
4.027
-0.238
-5.58%
1 jan 2006 ano
4.124
+0.097
2.4%
1 jan 2007 ano
3.39
-0.734
-17.8%
1 jan 2008 ano
2.513
-0.877
-25.87%
1 jan 2009 ano
3.277
+0.763
30.38%
Classificação de países por estatísticas atuais por anos


Comentários: