29
/pt/
pt
AIzaSyAYiBZKx7MnpbEhh9jyipgxe19OcubqV5w
April 1, 2024
158778
Iraq
IRQ
true
2
1
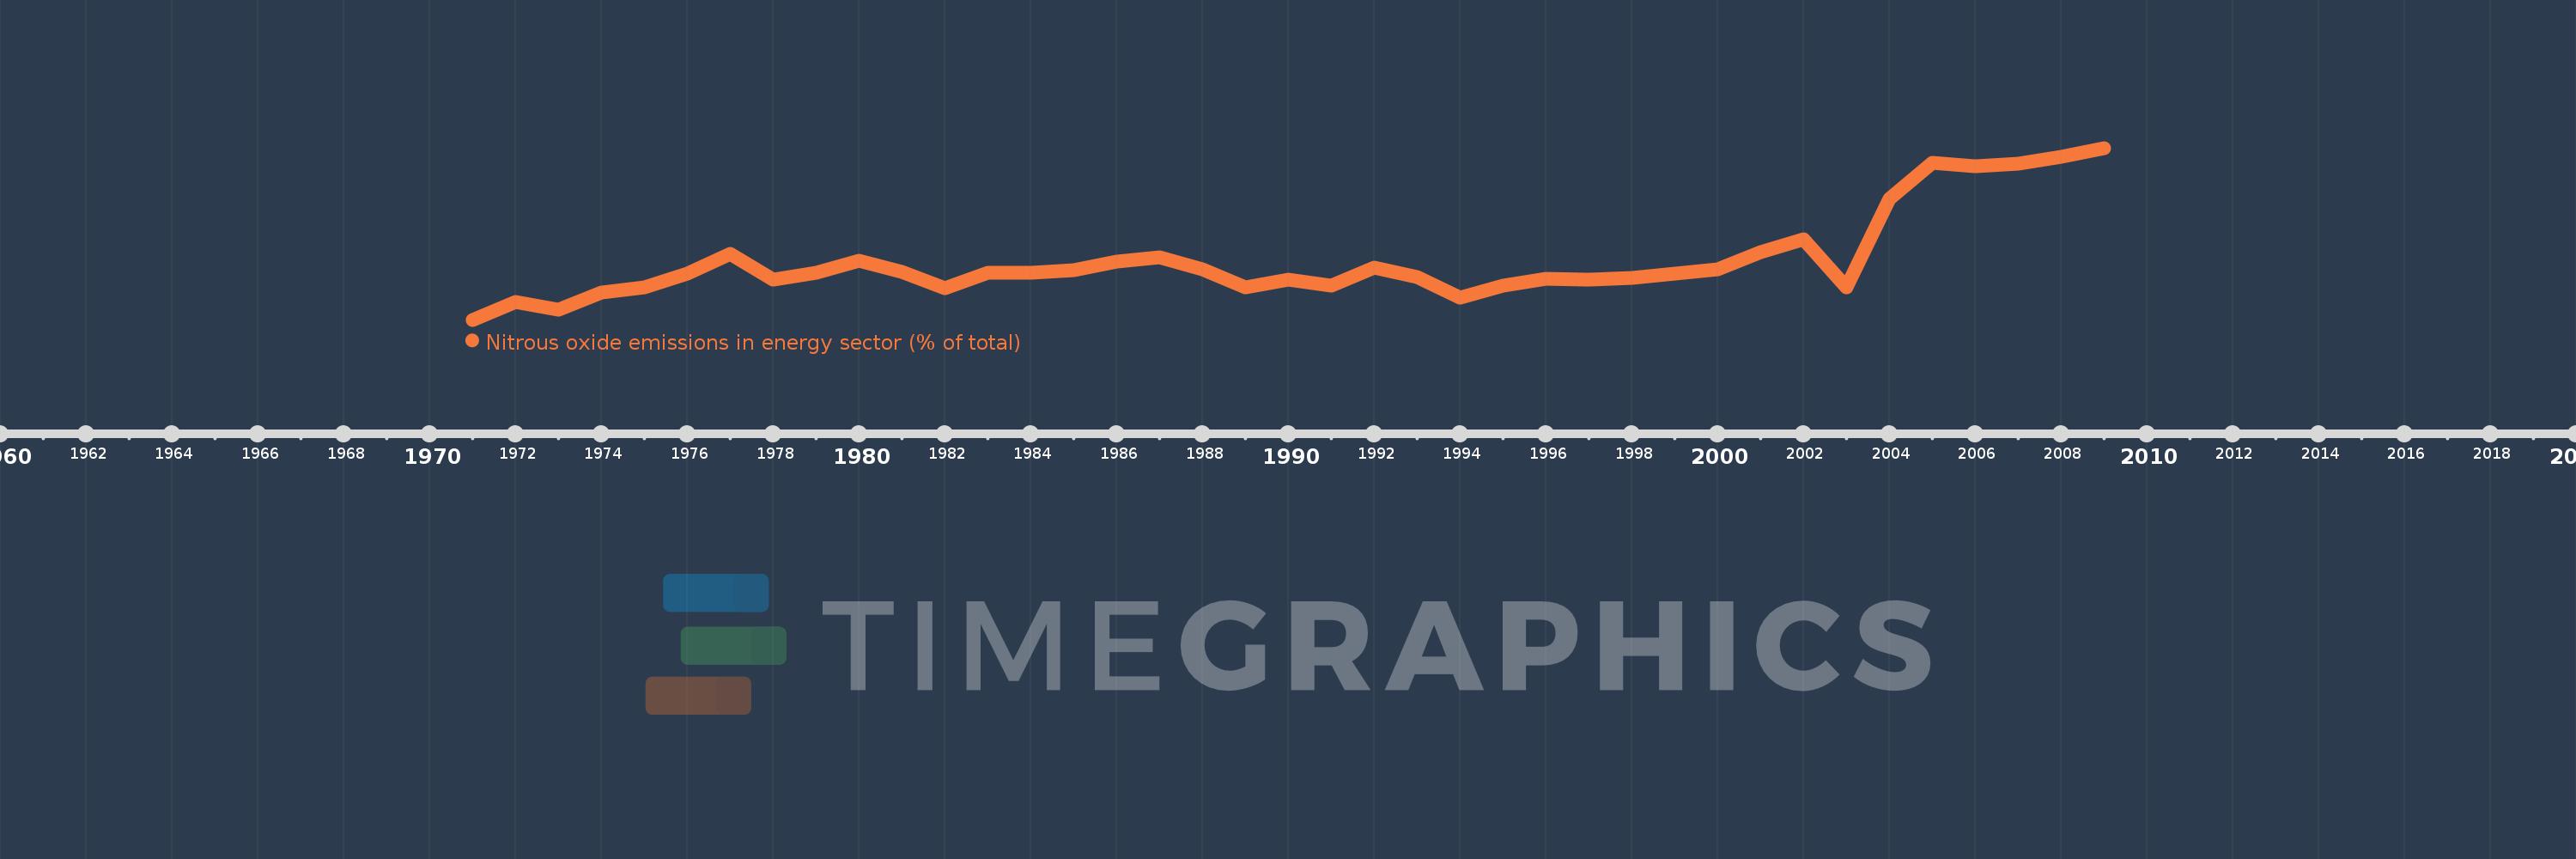
Nitrous oxide emissions in energy sector (% of total)
2009,2008,2007,2006,2005,2004,2003,2002,2001,2000,1999,1998,1997,1996,1995,1994,1993,1992,1991,1990,1989,1988,1987,1986,1985,1984,1983,1982,1981,1980,1979,1978,1977,1976,1975,1974,1973,1972,1971
Estas estatísticas em outros países:
AfghanistanAlbaniaAlgeriaAmerican SamoaAndorraAngolaAntigua and BarbudaArab WorldArgentinaArmeniaArubaAustraliaAustriaAzerbaijanBahamas, TheBahrainBangladeshBarbadosBelarusBelgiumBelizeBeninBermudaBhutanBoliviaBosnia and HerzegovinaBotswanaBrazilBritish Virgin IslandsBrunei DarussalamBulgariaBurkina FasoBurundiCabo VerdeCambodiaCameroonCanadaCaribbean small statesCayman IslandsCentral African RepublicCentral Europe and the BalticsChadChileChinaColombiaComorosCongo, Dem. Rep.Congo, Rep.Costa RicaCote d'IvoireCroatiaCubaCyprusCzech RepublicDenmarkDjiboutiDominicaDominican RepublicEarly-demographic dividendEast Asia & PacificEast Asia & Pacific (excluding high income)East Asia & Pacific (IDA & IBRD countries)EcuadorEgypt, Arab Rep.El SalvadorEquatorial GuineaEritreaEstoniaEthiopiaEuro areaEurope & Central AsiaEurope & Central Asia (excluding high income)Europe & Central Asia (IDA & IBRD countries)European UnionFaroe IslandsFijiFinlandFragile and conflict affected situationsFranceFrench PolynesiaGabonGambia, TheGeorgiaGermanyGhanaGibraltarGreeceGreenlandGrenadaGuamGuatemalaGuineaGuinea-BissauGuyanaHaitiHeavily indebted poor countries (HIPC)High incomeHondurasHong Kong SAR, ChinaHungaryIBRD onlyIcelandIDA & IBRD totalIDA blendIDA onlyIDA totalIndiaIndonesiaIran, Islamic Rep.IraqIrelandIsraelItalyJamaicaJapanJordanKazakhstanKenyaKiribatiKorea, Dem. People’s Rep.Korea, Rep.KuwaitKyrgyz RepublicLao PDRLate-demographic dividendLatin America & Caribbean Latin America & Caribbean (excluding high income)Latin America & the Caribbean (IDA & IBRD countries)LatviaLeast developed countries: UN classificationLebanonLesothoLiberiaLibyaLithuaniaLow & middle incomeLow incomeLower middle incomeLuxembourgMacao SAR, ChinaMacedonia, FYRMadagascarMalawiMalaysiaMaldivesMaliMaltaMarshall IslandsMauritaniaMauritiusMexicoMicronesia, Fed. Sts.Middle East & North AfricaMiddle East & North Africa (excluding high income)Middle East & North Africa (IDA & IBRD countries)Middle incomeMoldovaMongoliaMoroccoMozambiqueMyanmarNamibiaNauruNepalNetherlandsNew CaledoniaNew ZealandNicaraguaNigerNigeriaNorth AmericaNorthern Mariana IslandsNorwayOECD membersOmanOther small statesPacific island small statesPakistanPalauPanamaPapua New GuineaParaguayPeruPhilippinesPolandPortugalPost-demographic dividendPre-demographic dividendPuerto RicoQatarRomaniaRussian FederationRwandaSamoaSao Tome and PrincipeSaudi ArabiaSenegalSerbiaSeychellesSierra LeoneSingaporeSlovak RepublicSloveniaSmall statesSolomon IslandsSomaliaSouth AfricaSouth AsiaSouth Asia (IDA & IBRD)SpainSri LankaSt. Kitts and NevisSt. LuciaSt. Vincent and the GrenadinesSub-Saharan Africa Sub-Saharan Africa (excluding high income)Sub-Saharan Africa (IDA & IBRD countries)SudanSurinameSwazilandSwedenSwitzerlandSyrian Arab RepublicTajikistanTanzaniaThailandTimor-LesteTogoTongaTrinidad and TobagoTunisiaTurkeyTurkmenistanTurks and Caicos IslandsTuvaluUgandaUkraineUnited Arab EmiratesUnited KingdomUnited StatesUpper middle incomeUruguayUzbekistanVanuatuVenezuela, RBVietnamVirgin Islands (U.S.)WorldYemen, Rep.ZambiaZimbabwe Linha do tempo:
Nesta escala de tempo está apresentado um gráfico de 1971 ano até 2009 ano Iraq. Dados de 1970 ano ausente. O número de observações reais por data: 39.
Fonte (nome):
Indicadores de desenvolvimento mundial
Fonte (organização):
World Bank staff estimates from original source: European Commission, Joint Research Centre (JRC)/Netherlands Environmental Assessment Agency (PBL). Emission Database for Global Atmospheric Research (EDGAR): http://edgar.jrc.ec.europa.eu/.
Categorias:
Energy & Mining, Environment
Foi atualizado:
23 abr 2017 ano
Indicadores de alterações dos valores ao longo dos anos
Mínimo:
3.806
1 jan 1971 ano
Máximo:
10.301
1 jan 2009 ano
Na data de observação
Valor
Mudança absoluta
A alteração em relação ao valor anterior
1 jan 1971 ano
3.806
+3.806
0.0%
1 jan 1972 ano
4.479
+0.673
17.68%
1 jan 1973 ano
4.191
-0.288
-6.43%
1 jan 1974 ano
4.826
+0.635
15.14%
1 jan 1975 ano
5.038
+0.212
4.39%
1 jan 1976 ano
5.535
+0.497
9.87%
1 jan 1977 ano
6.296
+0.761
13.74%
1 jan 1978 ano
5.318
-0.978
-15.53%
1 jan 1979 ano
5.579
+0.26
4.9%
1 jan 1980 ano
6.043
+0.464
8.32%
1 jan 1981 ano
5.63
-0.412
-6.82%
1 jan 1982 ano
5.007
-0.623
-11.07%
1 jan 1983 ano
5.582
+0.575
11.48%
1 jan 1984 ano
5.587
+0.005
0.08%
1 jan 1985 ano
5.674
+0.087
1.56%
1 jan 1986 ano
6.0
+0.326
5.75%
1 jan 1987 ano
6.171
+0.172
2.86%
1 jan 1988 ano
5.716
-0.455
-7.37%
1 jan 1989 ano
5.016
-0.701
-12.26%
1 jan 1990 ano
5.318
+0.303
6.03%
1 jan 1991 ano
5.109
-0.209
-3.94%
1 jan 1992 ano
5.779
+0.67
13.12%
1 jan 1993 ano
5.431
-0.348
-6.03%
1 jan 1994 ano
4.65
-0.781
-14.37%
1 jan 1995 ano
5.089
+0.439
9.44%
1 jan 1996 ano
5.343
+0.254
4.99%
1 jan 1997 ano
5.338
-0.005
-0.09%
1 jan 1998 ano
5.4
+0.061
1.15%
1 jan 1999 ano
5.534
+0.134
2.49%
1 jan 2000 ano
5.714
+0.181
3.26%
1 jan 2001 ano
6.347
+0.632
11.06%
1 jan 2002 ano
6.841
+0.494
7.78%
1 jan 2003 ano
5.035
-1.806
-26.4%
1 jan 2004 ano
8.377
+3.342
66.37%
1 jan 2005 ano
9.746
+1.369
16.35%
1 jan 2006 ano
9.616
-0.129
-1.33%
1 jan 2007 ano
9.722
+0.106
1.1%
1 jan 2008 ano
9.967
+0.245
2.52%
1 jan 2009 ano
10.301
+0.334
3.35%
Classificação de países por estatísticas atuais por anos


Comentários: