29
/pt/
pt
AIzaSyAYiBZKx7MnpbEhh9jyipgxe19OcubqV5w
April 1, 2024
84787
Benin
BEN
true
2
1
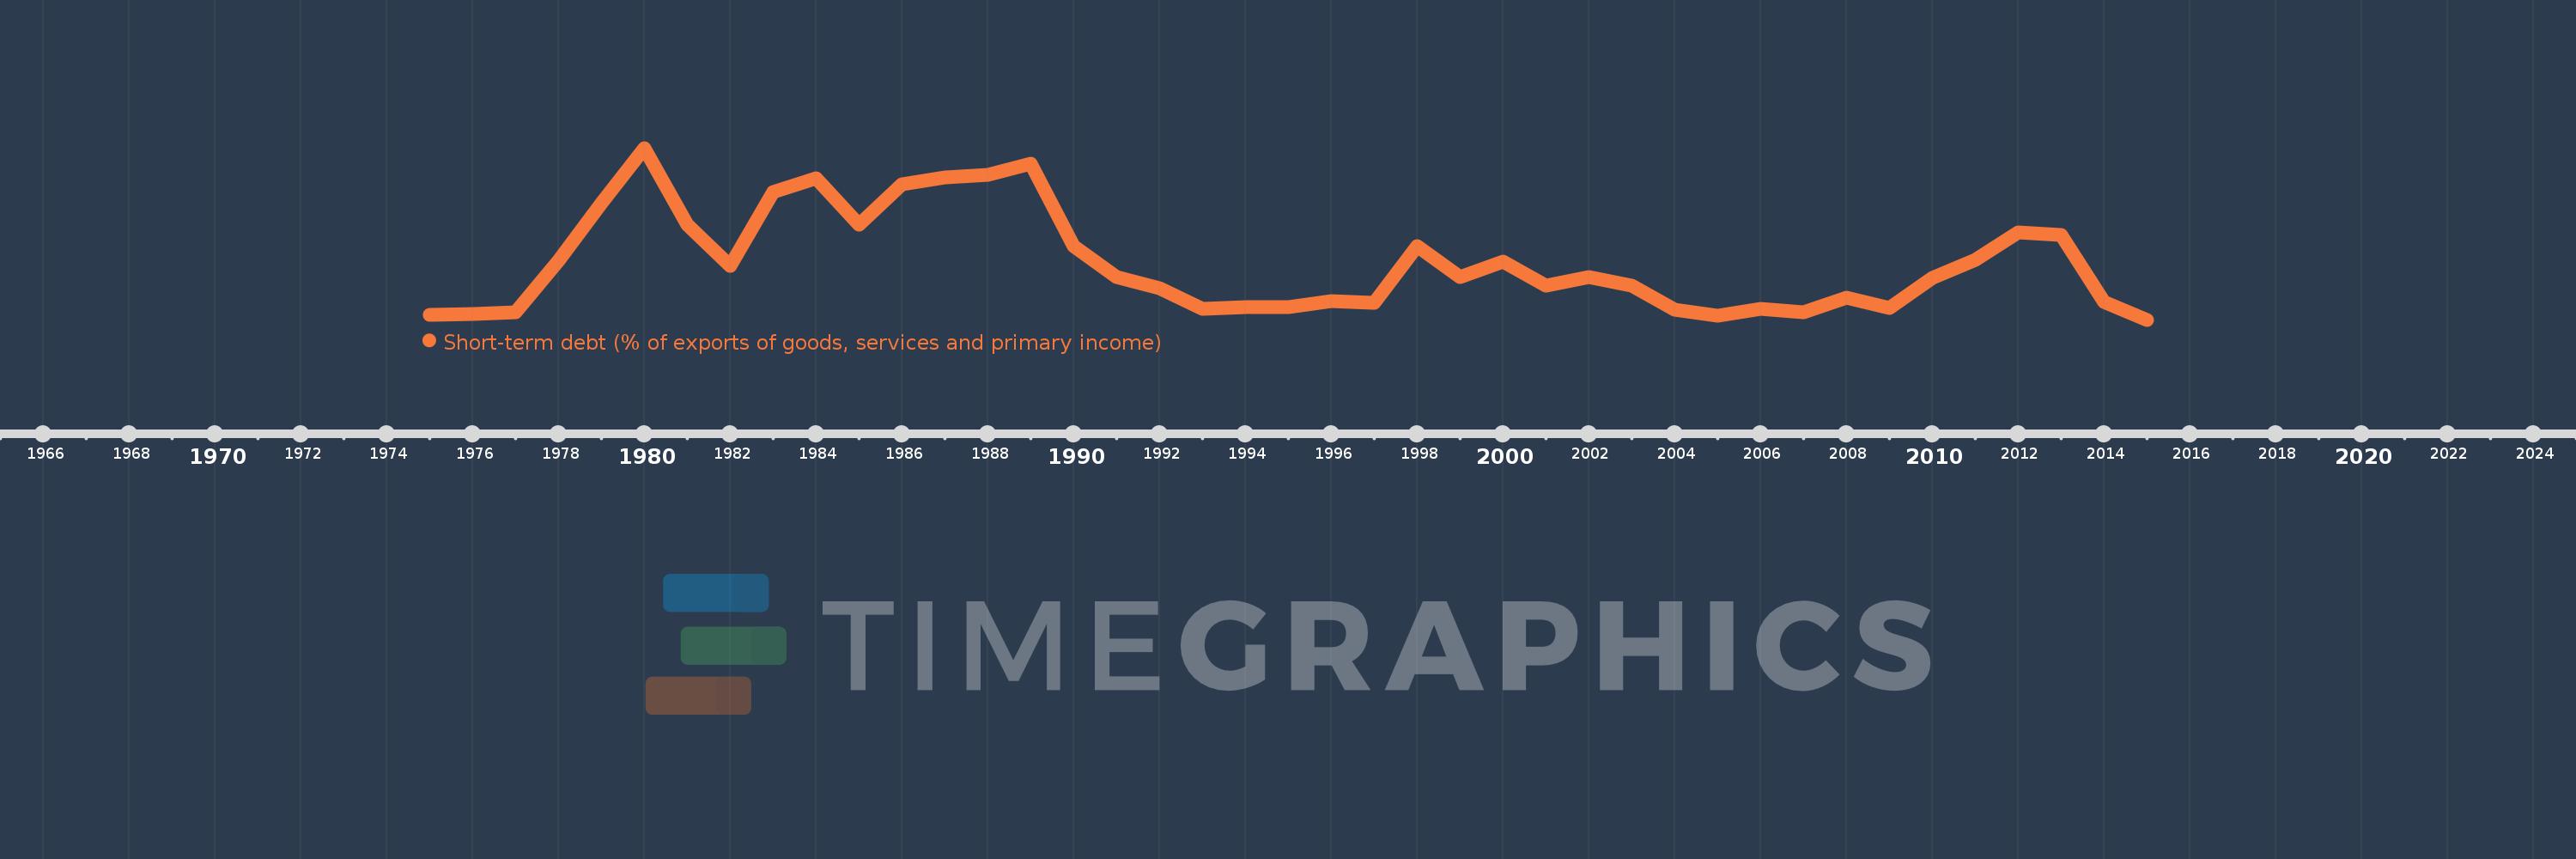
Short-term debt (% of exports of goods, services and primary income)
2015,2014,2013,2012,2011,2010,2009,2008,2007,2006,2005,2004,2003,2002,2001,2000,1999,1998,1997,1996,1995,1994,1993,1992,1991,1990,1989,1988,1987,1986,1985,1984,1983,1982,1981,1980,1979,1978,1977,1976,1975
Estas estatísticas em outros países:
Linha do tempo:
Nesta escala de tempo está apresentado um gráfico de 1975 ano até 2015 ano Benin. Dados de 1974 ano ausente. O número de observações reais por data: 41.
Fonte (nome):
Indicadores de desenvolvimento mundial
Fonte (organização):
World Bank, International Debt Statistics.
Categorias:
Economy & Growth, External Debt
Foi atualizado:
23 abr 2017 ano
Indicadores de alterações dos valores ao longo dos anos
Mínimo:
1.831
1 jan 2015 ano
Máximo:
53.647
1 jan 1980 ano
Na data de observação
Valor
Mudança absoluta
A alteração em relação ao valor anterior
1 jan 1975 ano
3.42
+3.42
0.0%
1 jan 1976 ano
3.574
+0.154
4.51%
1 jan 1977 ano
4.156
+0.582
16.28%
1 jan 1978 ano
19.656
+15.5
372.97%
1 jan 1979 ano
36.964
+17.308
88.05%
1 jan 1980 ano
53.647
+16.683
45.13%
1 jan 1981 ano
30.422
-23.225
-43.29%
1 jan 1982 ano
18.149
-12.273
-40.34%
1 jan 1983 ano
40.353
+22.204
122.34%
1 jan 1984 ano
44.446
+4.093
10.14%
1 jan 1985 ano
30.59
-13.856
-31.17%
1 jan 1986 ano
42.626
+12.036
39.34%
1 jan 1987 ano
44.708
+2.082
4.89%
1 jan 1988 ano
45.604
+0.897
2.01%
1 jan 1989 ano
48.96
+3.355
7.36%
1 jan 1990 ano
24.082
-24.878
-50.81%
1 jan 1991 ano
14.766
-9.316
-38.68%
1 jan 1992 ano
11.381
-3.386
-22.93%
1 jan 1993 ano
5.143
-6.237
-54.81%
1 jan 1994 ano
5.728
+0.585
11.38%
1 jan 1995 ano
5.537
-0.192
-3.35%
1 jan 1996 ano
7.37
+1.834
33.12%
1 jan 1997 ano
6.839
-0.532
-7.22%
1 jan 1998 ano
24.079
+17.241
252.11%
1 jan 1999 ano
14.625
-9.455
-39.26%
1 jan 2000 ano
19.499
+4.874
33.33%
1 jan 2001 ano
12.014
-7.485
-38.38%
1 jan 2002 ano
14.75
+2.736
22.77%
1 jan 2003 ano
12.09
-2.66
-18.03%
1 jan 2004 ano
4.763
-7.327
-60.61%
1 jan 2005 ano
3.153
-1.61
-33.8%
1 jan 2006 ano
5.128
+1.975
62.64%
1 jan 2007 ano
4.19
-0.938
-18.3%
1 jan 2008 ano
8.436
+4.246
101.34%
1 jan 2009 ano
5.334
-3.102
-36.77%
1 jan 2010 ano
14.32
+8.987
168.49%
1 jan 2011 ano
19.949
+5.629
39.31%
1 jan 2012 ano
28.135
+8.186
41.04%
1 jan 2013 ano
27.52
-0.616
-2.19%
1 jan 2014 ano
7.146
-20.373
-74.03%
1 jan 2015 ano
1.831
-5.315
-74.37%
Classificação de países por estatísticas atuais por anos


Comentários: