29
/pt/
pt
AIzaSyAYiBZKx7MnpbEhh9jyipgxe19OcubqV5w
April 1, 2024
224322
Philippines
PHL
true
2
1
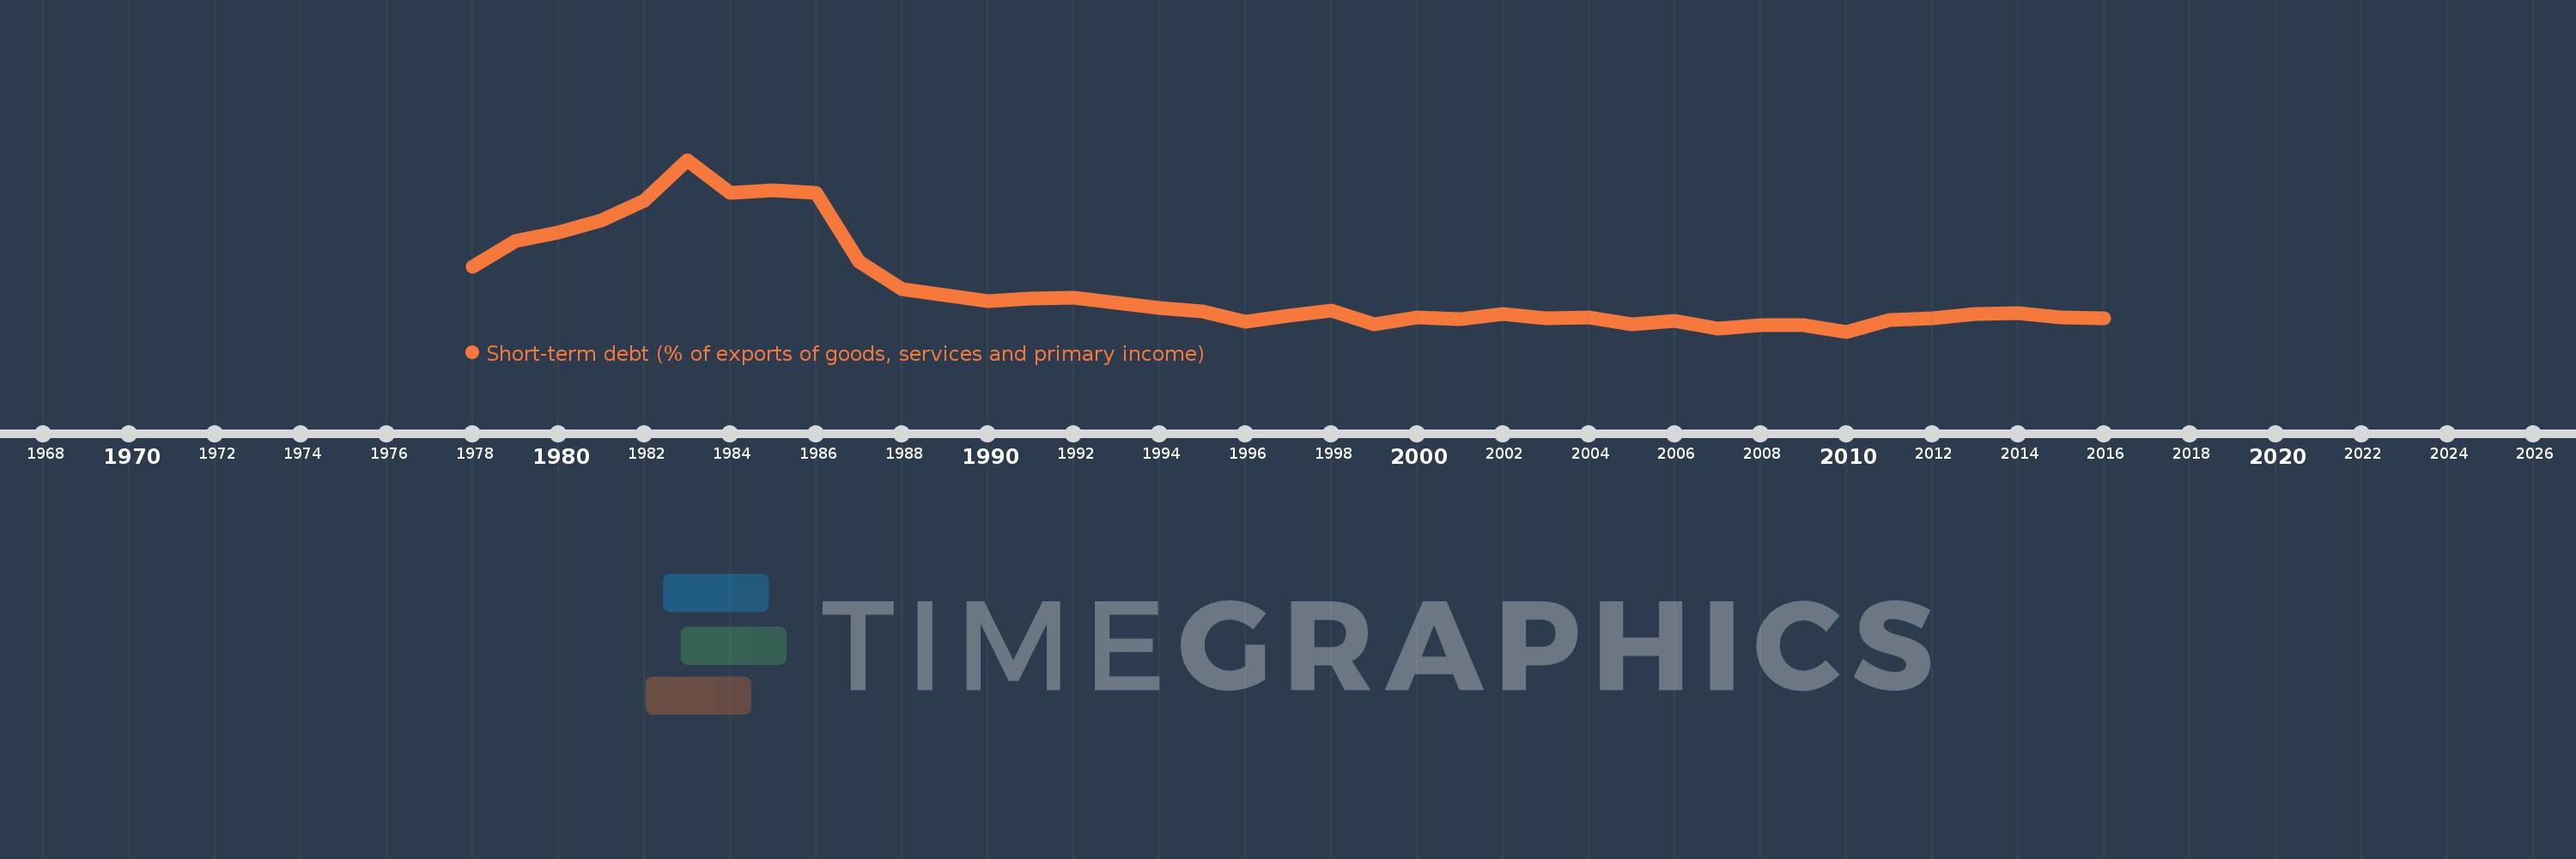
Short-term debt (% of exports of goods, services and primary income)
2016,2015,2014,2013,2012,2011,2010,2009,2008,2007,2006,2005,2004,2003,2002,2001,2000,1999,1998,1997,1996,1995,1994,1993,1992,1991,1990,1989,1988,1987,1986,1985,1984,1983,1982,1981,1980,1979,1978
Estas estatísticas em outros países:
Linha do tempo:
Nesta escala de tempo está apresentado um gráfico de 1978 ano até 2016 ano Philippines. Dados de 1977 ano ausente. O número de observações reais por data: 39.
Fonte (nome):
Indicadores de desenvolvimento mundial
Fonte (organização):
World Bank, International Debt Statistics.
Categorias:
Economy & Growth, External Debt
Foi atualizado:
23 abr 2017 ano
Indicadores de alterações dos valores ao longo dos anos
Mínimo:
8.064
1 jan 2010 ano
Máximo:
141.492
1 jan 1983 ano
Na data de observação
Valor
Mudança absoluta
A alteração em relação ao valor anterior
1 jan 1978 ano
58.263
+58.263
0.0%
1 jan 1979 ano
78.676
+20.414
35.04%
1 jan 1980 ano
84.972
+6.296
8.0%
1 jan 1981 ano
94.485
+9.513
11.2%
1 jan 1982 ano
109.763
+15.278
16.17%
1 jan 1983 ano
141.492
+31.728
28.91%
1 jan 1984 ano
115.842
-25.65
-18.13%
1 jan 1985 ano
117.999
+2.157
1.86%
1 jan 1986 ano
115.666
-2.333
-1.98%
1 jan 1987 ano
62.337
-53.329
-46.11%
1 jan 1988 ano
41.39
-20.947
-33.6%
1 jan 1989 ano
36.246
-5.144
-12.43%
1 jan 1990 ano
31.872
-4.374
-12.07%
1 jan 1991 ano
33.982
+2.111
6.62%
1 jan 1992 ano
34.185
+0.202
0.6%
1 jan 1993 ano
30.346
-3.839
-11.23%
1 jan 1994 ano
26.68
-3.666
-12.08%
1 jan 1995 ano
23.784
-2.896
-10.85%
1 jan 1996 ano
16.064
-7.72
-32.46%
1 jan 1997 ano
20.151
+4.086
25.44%
1 jan 1998 ano
24.539
+4.388
21.78%
1 jan 1999 ano
13.491
-11.047
-45.02%
1 jan 2000 ano
18.816
+5.325
39.47%
1 jan 2001 ano
17.843
-0.974
-5.17%
1 jan 2002 ano
21.448
+3.606
20.21%
1 jan 2003 ano
18.316
-3.132
-14.6%
1 jan 2004 ano
18.99
+0.674
3.68%
1 jan 2005 ano
13.906
-5.084
-26.77%
1 jan 2006 ano
16.604
+2.699
19.41%
1 jan 2007 ano
10.463
-6.142
-36.99%
1 jan 2008 ano
13.193
+2.73
26.09%
1 jan 2009 ano
12.79
-0.403
-3.06%
1 jan 2010 ano
8.064
-4.726
-36.95%
1 jan 2011 ano
17.164
+9.1
112.85%
1 jan 2012 ano
18.599
+1.434
8.36%
1 jan 2013 ano
21.913
+3.314
17.82%
1 jan 2014 ano
22.188
+0.276
1.26%
1 jan 2015 ano
19.32
-2.868
-12.93%
1 jan 2016 ano
18.408
-0.912
-4.72%
Classificação de países por estatísticas atuais por anos


Comentários: