29
/pt/
pt
AIzaSyAYiBZKx7MnpbEhh9jyipgxe19OcubqV5w
April 1, 2024
217171
Pakistan
PAK
true
2
1
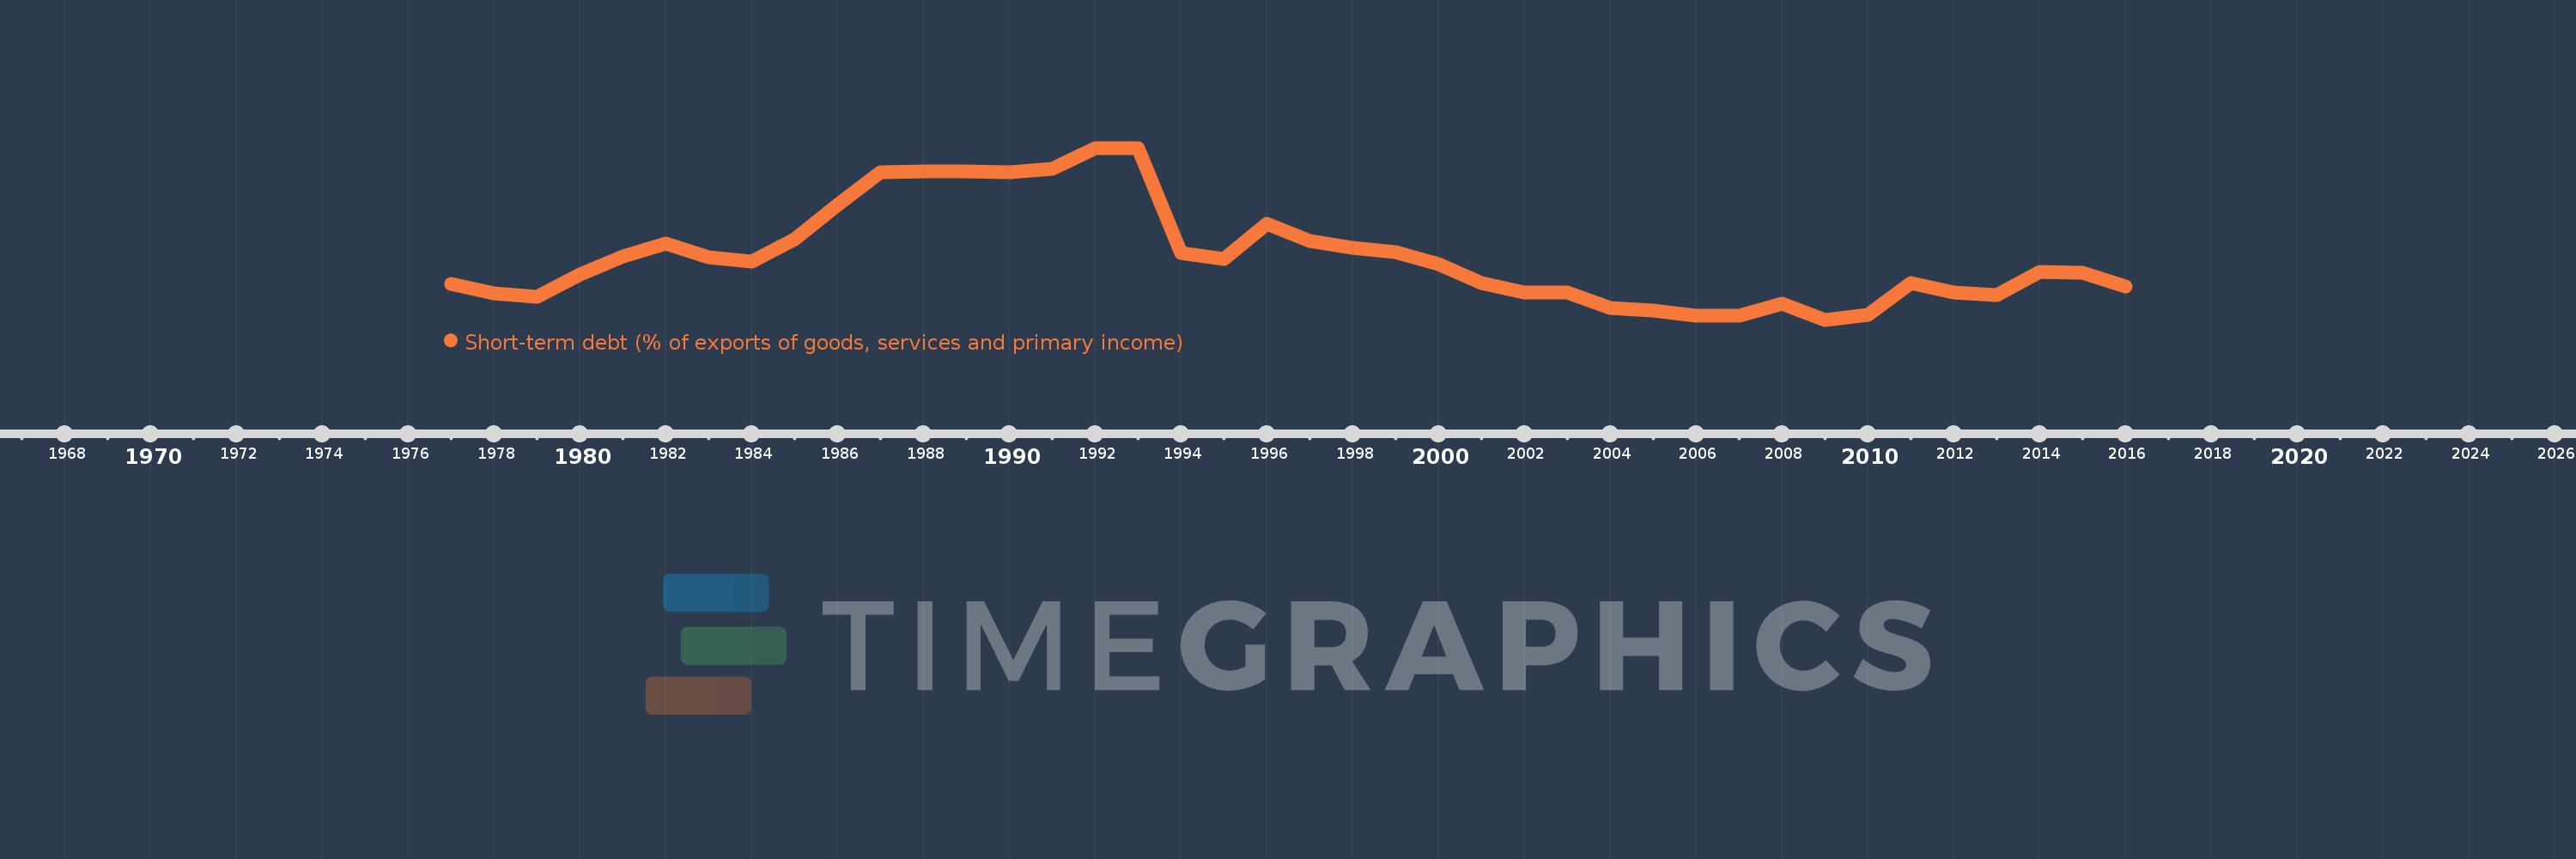
Short-term debt (% of exports of goods, services and primary income)
2016,2015,2014,2013,2012,2011,2010,2009,2008,2007,2006,2005,2004,2003,2002,2001,2000,1999,1998,1997,1996,1995,1994,1993,1992,1991,1990,1989,1988,1987,1986,1985,1984,1983,1982,1981,1980,1979,1978,1977
Estas estatísticas em outros países:
Linha do tempo:
Nesta escala de tempo está apresentado um gráfico de 1977 ano até 2016 ano Pakistan. Dados de 1976 ano ausente. O número de observações reais por data: 40.
Fonte (nome):
Indicadores de desenvolvimento mundial
Fonte (organização):
World Bank, International Debt Statistics.
Categorias:
Economy & Growth, External Debt
Foi atualizado:
23 abr 2017 ano
Indicadores de alterações dos valores ao longo dos anos
Mínimo:
5.115
1 jan 2009 ano
Máximo:
51.581
1 jan 1992 ano
Na data de observação
Valor
Mudança absoluta
A alteração em relação ao valor anterior
1 jan 1977 ano
14.846
+14.846
0.0%
1 jan 1978 ano
12.228
-2.617
-17.63%
1 jan 1979 ano
11.377
-0.852
-6.96%
1 jan 1980 ano
17.347
+5.971
52.48%
1 jan 1981 ano
22.206
+4.859
28.01%
1 jan 1982 ano
25.79
+3.584
16.14%
1 jan 1983 ano
21.935
-3.855
-14.95%
1 jan 1984 ano
20.848
-1.087
-4.96%
1 jan 1985 ano
26.792
+5.944
28.51%
1 jan 1986 ano
36.174
+9.382
35.02%
1 jan 1987 ano
44.966
+8.793
24.31%
1 jan 1988 ano
45.201
+0.234
0.52%
1 jan 1989 ano
45.181
-0.02
-0.04%
1 jan 1990 ano
45.078
-0.103
-0.23%
1 jan 1991 ano
45.949
+0.871
1.93%
1 jan 1992 ano
51.581
+5.632
12.26%
1 jan 1993 ano
51.417
-0.164
-0.32%
1 jan 1994 ano
23.087
-28.33
-55.1%
1 jan 1995 ano
21.488
-1.598
-6.92%
1 jan 1996 ano
31.105
+9.617
44.75%
1 jan 1997 ano
26.321
-4.785
-15.38%
1 jan 1998 ano
24.51
-1.811
-6.88%
1 jan 1999 ano
23.375
-1.135
-4.63%
1 jan 2000 ano
20.192
-3.183
-13.62%
1 jan 2001 ano
15.015
-5.177
-25.64%
1 jan 2002 ano
12.413
-2.602
-17.33%
1 jan 2003 ano
12.535
+0.122
0.98%
1 jan 2004 ano
8.325
-4.21
-33.58%
1 jan 2005 ano
7.662
-0.663
-7.96%
1 jan 2006 ano
6.224
-1.439
-18.78%
1 jan 2007 ano
6.175
-0.049
-0.78%
1 jan 2008 ano
9.56
+3.385
54.82%
1 jan 2009 ano
5.115
-4.445
-46.49%
1 jan 2010 ano
6.396
+1.281
25.04%
1 jan 2011 ano
15.079
+8.683
135.75%
1 jan 2012 ano
12.592
-2.487
-16.49%
1 jan 2013 ano
11.894
-0.698
-5.54%
1 jan 2014 ano
18.023
+6.129
51.53%
1 jan 2015 ano
17.802
-0.221
-1.23%
1 jan 2016 ano
14.169
-3.633
-20.41%
Classificação de países por estatísticas atuais por anos


Comentários: