29
/pt/
pt
AIzaSyAYiBZKx7MnpbEhh9jyipgxe19OcubqV5w
April 1, 2024
198290
Moldova
MDA
true
2
1
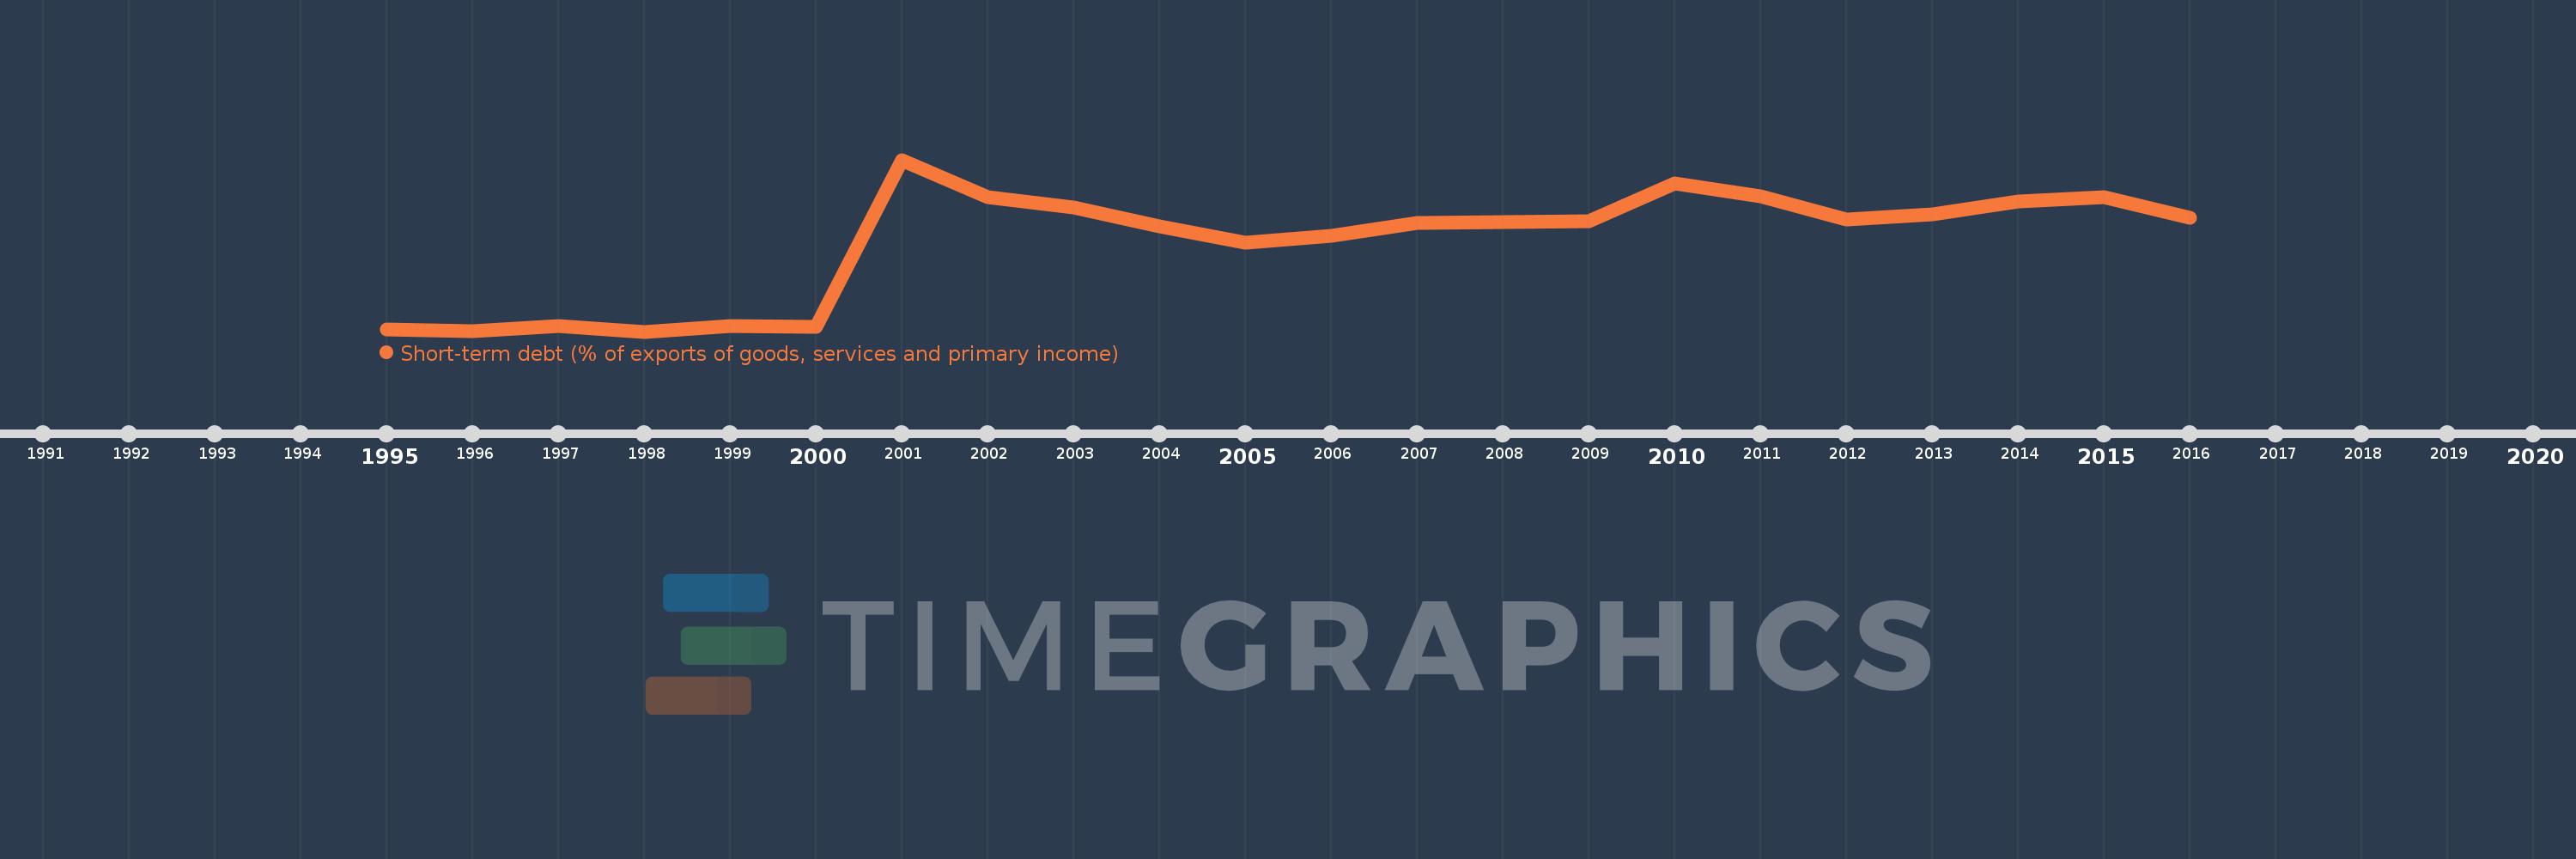
Short-term debt (% of exports of goods, services and primary income)
2016,2015,2014,2013,2012,2011,2010,2009,2008,2007,2006,2005,2004,2003,2002,2001,2000,1999,1998,1997,1996,1995
Estas estatísticas em outros países:
Linha do tempo:
Nesta escala de tempo está apresentado um gráfico de 1995 ano até 2016 ano Moldova. Dados de 1994 ano ausente. O número de observações reais por data: 22.
Fonte (nome):
Indicadores de desenvolvimento mundial
Fonte (organização):
World Bank, International Debt Statistics.
Categorias:
Economy & Growth, External Debt
Foi atualizado:
23 abr 2017 ano
Indicadores de alterações dos valores ao longo dos anos
Mínimo:
0.353
1 jan 1998 ano
Máximo:
68.749
1 jan 2001 ano
Na data de observação
Valor
Mudança absoluta
A alteração em relação ao valor anterior
1 jan 1995 ano
1.216
+1.216
0.0%
1 jan 1996 ano
0.664
-0.552
-45.38%
1 jan 1997 ano
2.606
+1.941
292.27%
1 jan 1998 ano
0.353
-2.253
-86.45%
1 jan 1999 ano
2.405
+2.052
581.01%
1 jan 2000 ano
2.389
-0.016
-0.66%
1 jan 2001 ano
68.749
+66.36
2.78 mil%
1 jan 2002 ano
53.814
-14.935
-21.72%
1 jan 2003 ano
49.629
-4.184
-7.78%
1 jan 2004 ano
42.331
-7.299
-14.71%
1 jan 2005 ano
35.583
-6.748
-15.94%
1 jan 2006 ano
38.343
+2.76
7.76%
1 jan 2007 ano
43.68
+5.338
13.92%
1 jan 2008 ano
43.94
+0.26
0.6%
1 jan 2009 ano
44.436
+0.495
1.13%
1 jan 2010 ano
59.372
+14.937
33.61%
1 jan 2011 ano
54.104
-5.269
-8.87%
1 jan 2012 ano
45.058
-9.046
-16.72%
1 jan 2013 ano
46.922
+1.864
4.14%
1 jan 2014 ano
52.068
+5.146
10.97%
1 jan 2015 ano
53.886
+1.818
3.49%
1 jan 2016 ano
45.687
-8.199
-15.22%
Classificação de países por estatísticas atuais por anos


Comentários: