29
/pt/
pt
AIzaSyAYiBZKx7MnpbEhh9jyipgxe19OcubqV5w
April 1, 2024
84249
Benin
BEN
true
2
1
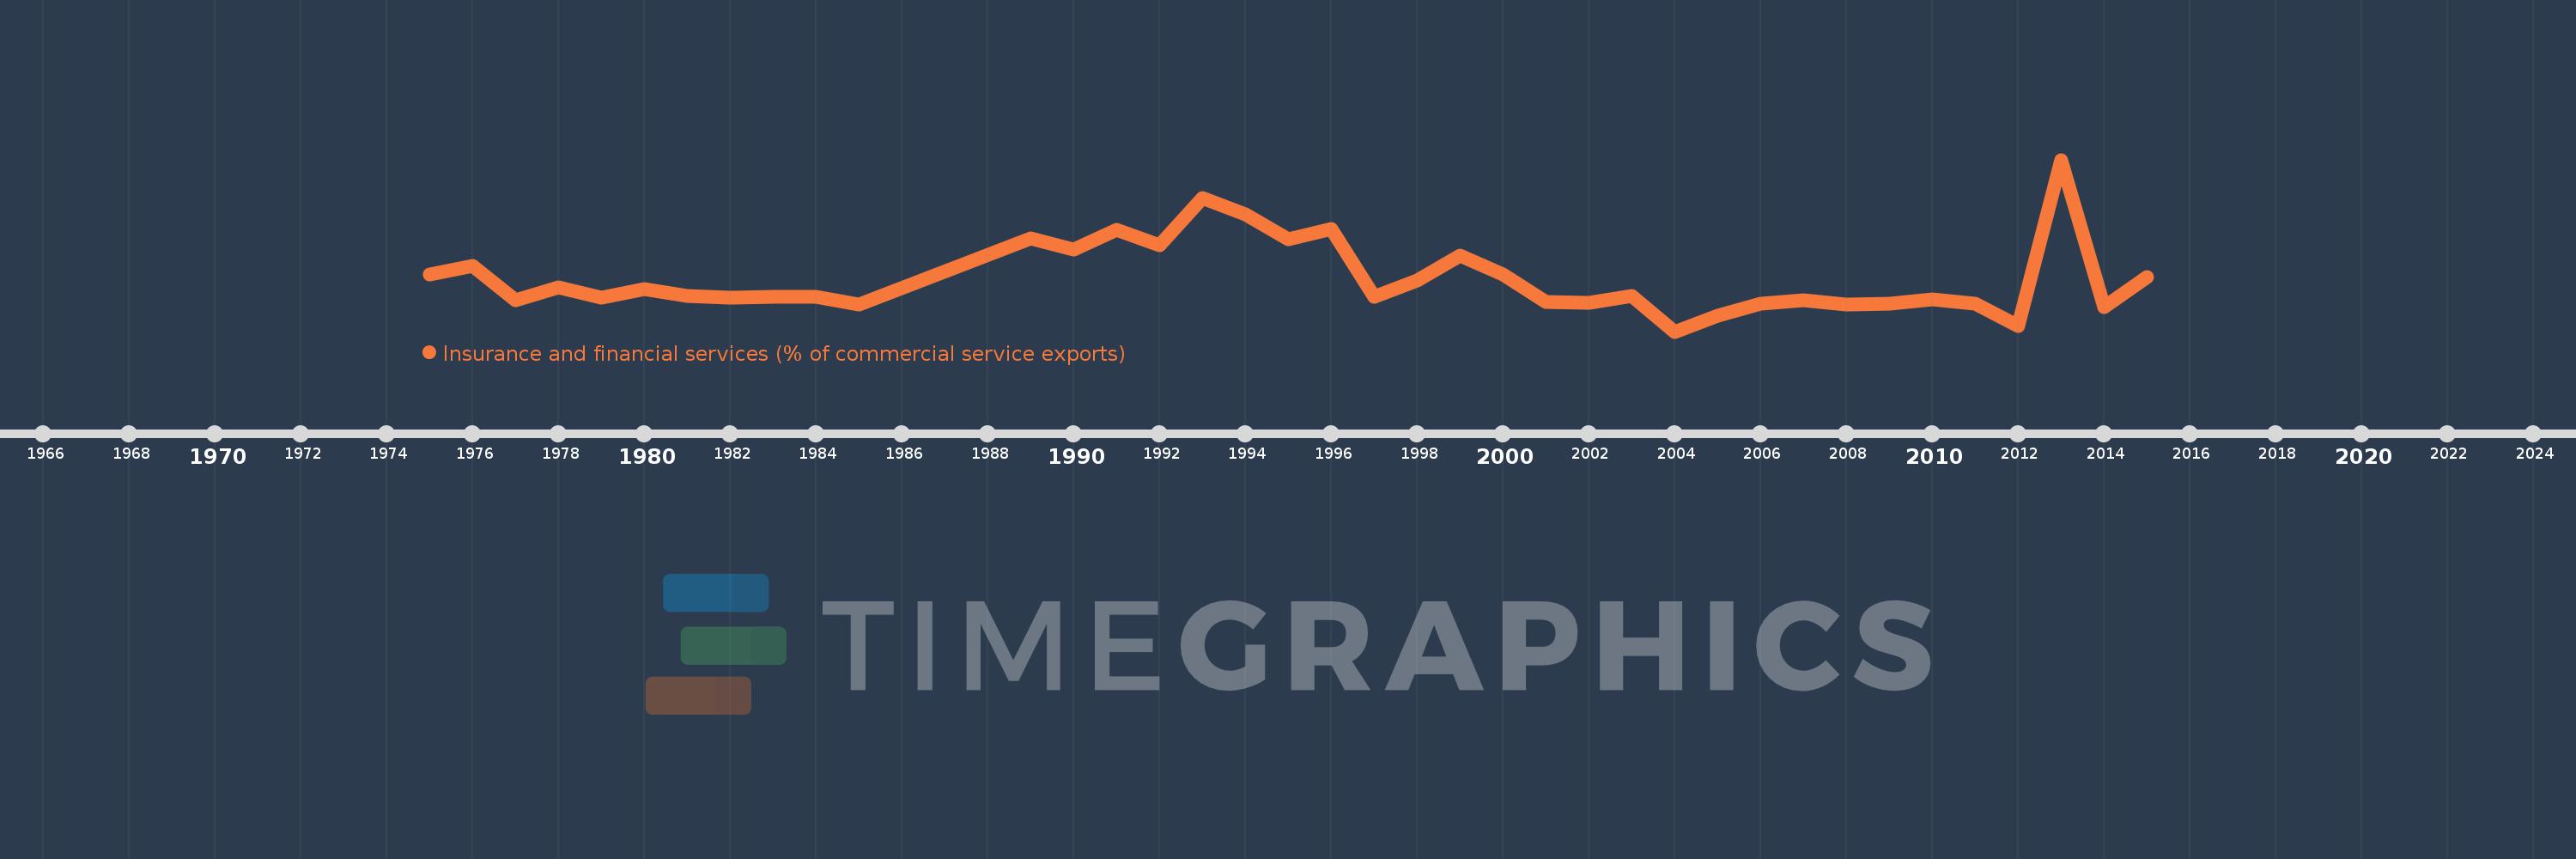
Insurance and financial services (% of commercial service exports)
2015,2014,2013,2012,2011,2010,2009,2008,2007,2006,2005,2004,2003,2002,2001,2000,1999,1998,1997,1996,1995,1994,1993,1992,1991,1990,1989,1985,1984,1983,1982,1981,1980,1979,1978,1977,1976,1975
Estas estatísticas em outros países:
AfghanistanAlbaniaAlgeriaAngolaAntigua and BarbudaArab WorldArgentinaArmeniaArubaAustraliaAustriaAzerbaijanBahrainBangladeshBarbadosBelarusBelgiumBelizeBeninBermudaBhutanBoliviaBosnia and HerzegovinaBotswanaBrazilBrunei DarussalamBulgariaBurkina FasoBurundiCabo VerdeCambodiaCameroonCanadaCaribbean small statesCentral African RepublicCentral Europe and the BalticsChadChileChinaColombiaComorosCongo, Dem. Rep.Congo, Rep.Costa RicaCote d'IvoireCroatiaCuracaoCyprusCzech RepublicDenmarkDominicaDominican RepublicEarly-demographic dividendEast Asia & PacificEast Asia & Pacific (excluding high income)East Asia & Pacific (IDA & IBRD countries)EcuadorEgypt, Arab Rep.El SalvadorEritreaEstoniaEthiopiaEuro areaEurope & Central AsiaEurope & Central Asia (excluding high income)Europe & Central Asia (IDA & IBRD countries)European UnionFaroe IslandsFijiFinlandFragile and conflict affected situationsFranceFrench PolynesiaGabonGambia, TheGeorgiaGermanyGhanaGreeceGrenadaGuatemalaGuineaGuinea-BissauGuyanaHaitiHeavily indebted poor countries (HIPC)High incomeHondurasHong Kong SAR, ChinaHungaryIBRD onlyIcelandIDA & IBRD totalIDA onlyIDA totalIndiaIndonesiaIran, Islamic Rep.IraqIrelandIsraelItalyJamaicaJapanJordanKazakhstanKenyaKiribatiKorea, Rep.KosovoKuwaitKyrgyz RepublicLao PDRLate-demographic dividendLatin America & Caribbean Latin America & Caribbean (excluding high income)Latin America & the Caribbean (IDA & IBRD countries)LatviaLeast developed countries: UN classificationLebanonLesothoLiberiaLibyaLithuaniaLow & middle incomeLow incomeLower middle incomeLuxembourgMacao SAR, ChinaMacedonia, FYRMadagascarMalawiMalaysiaMaldivesMaliMaltaMauritaniaMauritiusMexicoMiddle East & North AfricaMiddle East & North Africa (excluding high income)Middle East & North Africa (IDA & IBRD countries)Middle incomeMoldovaMongoliaMontenegroMoroccoMozambiqueMyanmarNamibiaNepalNetherlandsNew CaledoniaNew ZealandNicaraguaNigerNigeriaNorth AmericaNorwayOECD membersOmanOther small statesPacific island small statesPakistanPalauPanamaPapua New GuineaParaguayPeruPhilippinesPolandPortugalPost-demographic dividendPre-demographic dividendQatarRomaniaRussian FederationRwandaSamoaSao Tome and PrincipeSaudi ArabiaSenegalSerbiaSeychellesSierra LeoneSingaporeSint Maarten (Dutch part)Slovak RepublicSloveniaSmall statesSolomon IslandsSouth AfricaSouth AsiaSouth Asia (IDA & IBRD)South SudanSpainSri LankaSt. Kitts and NevisSt. LuciaSt. Vincent and the GrenadinesSub-Saharan Africa Sub-Saharan Africa (excluding high income)Sub-Saharan Africa (IDA & IBRD countries)SudanSurinameSwazilandSwedenSwitzerlandSyrian Arab RepublicTajikistanTanzaniaThailandTimor-LesteTogoTongaTrinidad and TobagoTunisiaTurkeyTuvaluUgandaUkraineUnited KingdomUnited StatesUpper middle incomeUruguayVanuatuVenezuela, RBWest Bank and GazaWorldZambiaZimbabwe Linha do tempo:
Nesta escala de tempo está apresentado um gráfico de 1975 ano até 2015 ano Benin. Dados de 1974 ano ausente. O número de observações reais por data: 38.
Fonte (nome):
Indicadores de desenvolvimento mundial
Fonte (organização):
International Monetary Fund, Balance of Payments Statistics Yearbook and data files.
Categorias:
Private Sector, Trade
Foi atualizado:
23 abr 2017 ano
Indicadores de alterações dos valores ao longo dos anos
Mínimo:
0.511
1 jan 2004 ano
Máximo:
11.24
1 jan 2013 ano
Na data de observação
Valor
Mudança absoluta
A alteração em relação ao valor anterior
1 jan 1975 ano
4.078
+4.078
0.0%
1 jan 1976 ano
4.607
+0.529
12.97%
1 jan 1977 ano
2.492
-2.115
-45.91%
1 jan 1978 ano
3.265
+0.773
31.01%
1 jan 1979 ano
2.617
-0.647
-19.82%
1 jan 1980 ano
3.179
+0.561
21.44%
1 jan 1981 ano
2.715
-0.464
-14.59%
1 jan 1982 ano
2.613
-0.102
-3.75%
1 jan 1983 ano
2.694
+0.081
3.11%
1 jan 1984 ano
2.697
+0.003
0.11%
1 jan 1985 ano
2.189
-0.508
-18.84%
1 jan 1989 ano
6.343
+4.154
189.76%
1 jan 1990 ano
5.609
-0.734
-11.56%
1 jan 1991 ano
6.865
+1.256
22.39%
1 jan 1992 ano
5.882
-0.983
-14.32%
1 jan 1993 ano
8.864
+2.982
50.69%
1 jan 1994 ano
7.851
-1.013
-11.43%
1 jan 1995 ano
6.283
-1.568
-19.97%
1 jan 1996 ano
6.941
+0.658
10.47%
1 jan 1997 ano
2.684
-4.257
-61.33%
1 jan 1998 ano
3.68
+0.996
37.12%
1 jan 1999 ano
5.246
+1.566
42.54%
1 jan 2000 ano
4.076
-1.17
-22.3%
1 jan 2001 ano
2.349
-1.727
-42.38%
1 jan 2002 ano
2.333
-0.015
-0.66%
1 jan 2003 ano
2.75
+0.417
17.87%
1 jan 2004 ano
0.511
-2.239
-81.43%
1 jan 2005 ano
1.494
+0.984
192.67%
1 jan 2006 ano
2.278
+0.784
52.43%
1 jan 2007 ano
2.472
+0.194
8.53%
1 jan 2008 ano
2.197
-0.275
-11.14%
1 jan 2009 ano
2.247
+0.05
2.27%
1 jan 2010 ano
2.496
+0.249
11.09%
1 jan 2011 ano
2.243
-0.253
-10.13%
1 jan 2012 ano
0.868
-1.375
-61.32%
1 jan 2013 ano
11.24
+10.373
1.2 mil%
1 jan 2014 ano
2.041
-9.2
-81.85%
1 jan 2015 ano
3.92
+1.879
92.08%
Classificação de países por estatísticas atuais por anos


Comentários: