29
/pt/
pt
AIzaSyAYiBZKx7MnpbEhh9jyipgxe19OcubqV5w
April 1, 2024
226048
Portugal
PRT
true
2
1
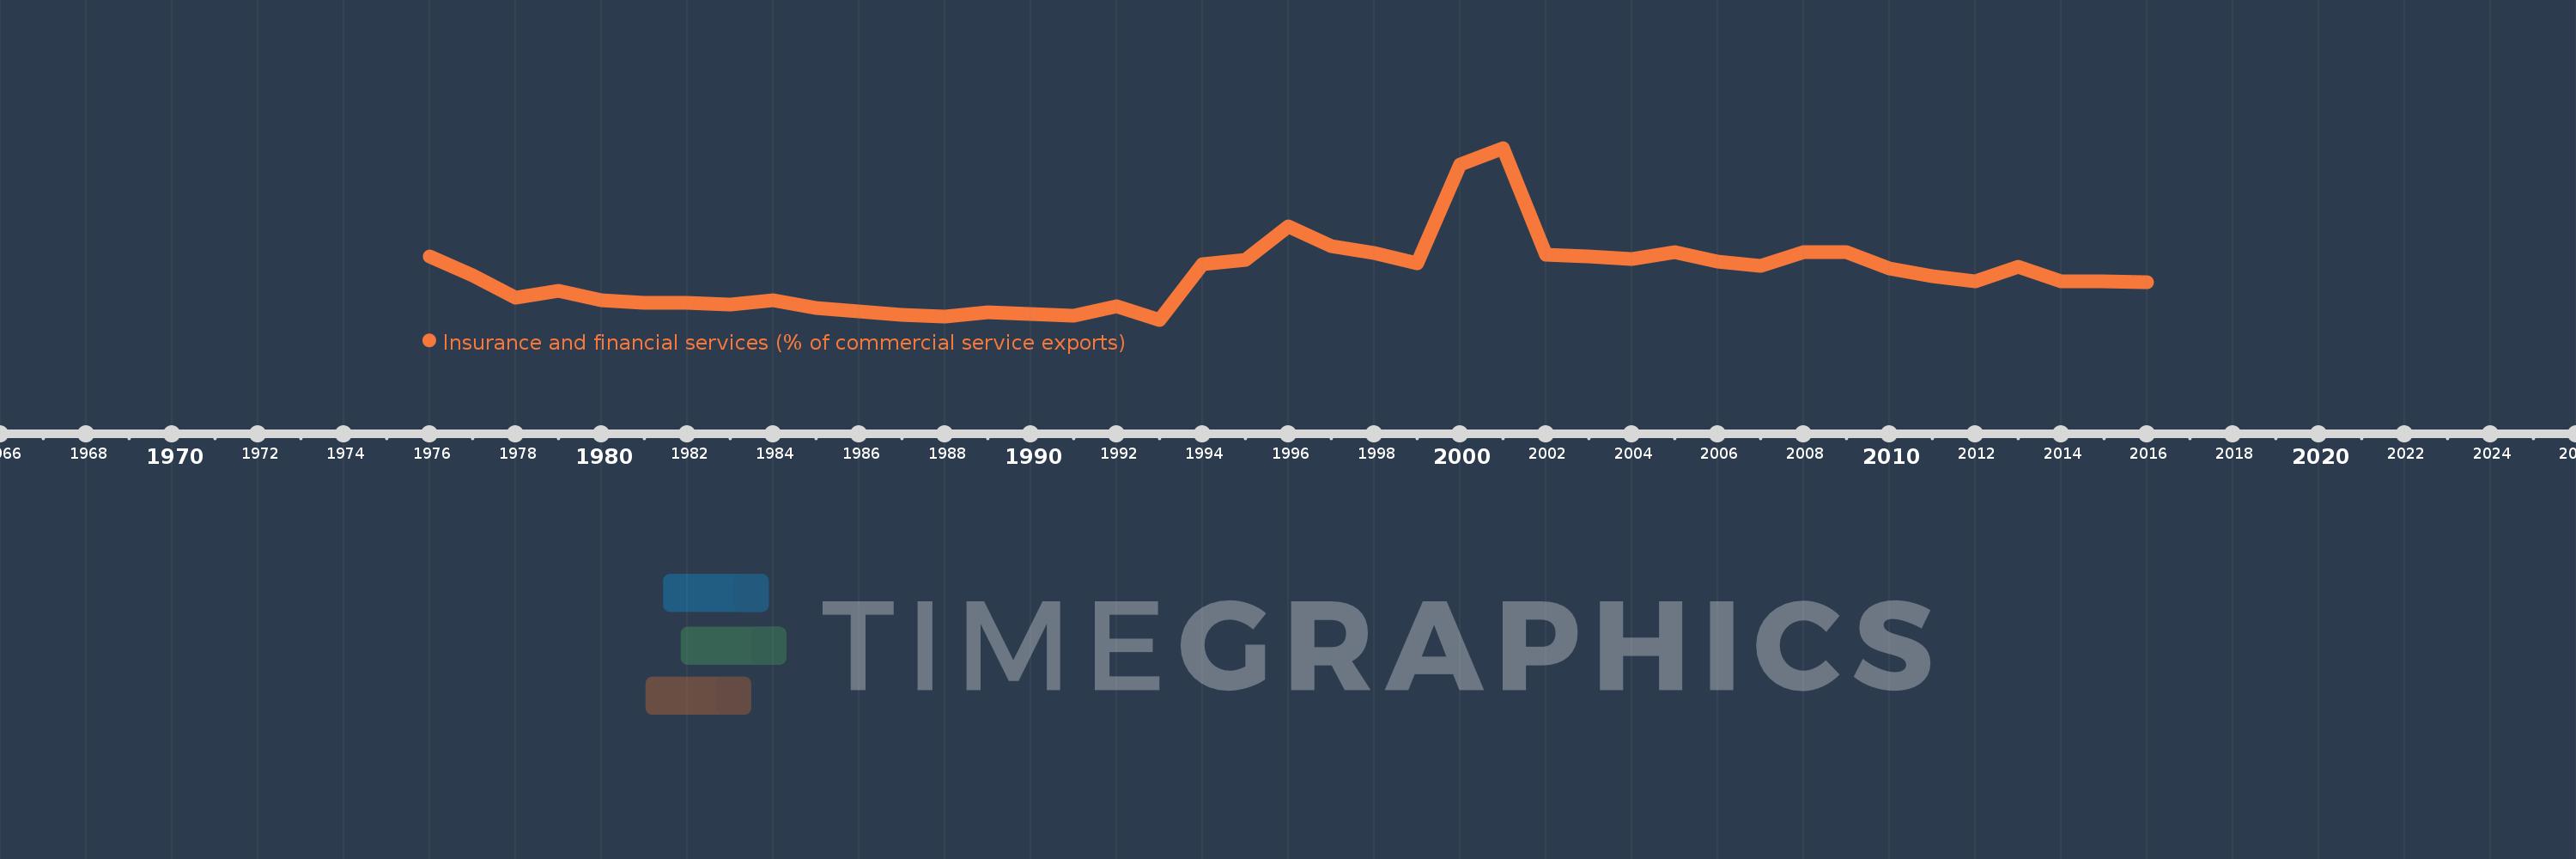
Insurance and financial services (% of commercial service exports)
2016,2015,2014,2013,2012,2011,2010,2009,2008,2007,2006,2005,2004,2003,2002,2001,2000,1999,1998,1997,1996,1995,1994,1993,1992,1991,1990,1989,1988,1987,1986,1985,1984,1983,1982,1981,1980,1979,1978,1977,1976
Estas estatísticas em outros países:
AfghanistanAlbaniaAlgeriaAngolaAntigua and BarbudaArab WorldArgentinaArmeniaArubaAustraliaAustriaAzerbaijanBahrainBangladeshBarbadosBelarusBelgiumBelizeBeninBermudaBhutanBoliviaBosnia and HerzegovinaBotswanaBrazilBrunei DarussalamBulgariaBurkina FasoBurundiCabo VerdeCambodiaCameroonCanadaCaribbean small statesCentral African RepublicCentral Europe and the BalticsChadChileChinaColombiaComorosCongo, Dem. Rep.Congo, Rep.Costa RicaCote d'IvoireCroatiaCuracaoCyprusCzech RepublicDenmarkDominicaDominican RepublicEarly-demographic dividendEast Asia & PacificEast Asia & Pacific (excluding high income)East Asia & Pacific (IDA & IBRD countries)EcuadorEgypt, Arab Rep.El SalvadorEritreaEstoniaEthiopiaEuro areaEurope & Central AsiaEurope & Central Asia (excluding high income)Europe & Central Asia (IDA & IBRD countries)European UnionFaroe IslandsFijiFinlandFragile and conflict affected situationsFranceFrench PolynesiaGabonGambia, TheGeorgiaGermanyGhanaGreeceGrenadaGuatemalaGuineaGuinea-BissauGuyanaHaitiHeavily indebted poor countries (HIPC)High incomeHondurasHong Kong SAR, ChinaHungaryIBRD onlyIcelandIDA & IBRD totalIDA onlyIDA totalIndiaIndonesiaIran, Islamic Rep.IraqIrelandIsraelItalyJamaicaJapanJordanKazakhstanKenyaKiribatiKorea, Rep.KosovoKuwaitKyrgyz RepublicLao PDRLate-demographic dividendLatin America & Caribbean Latin America & Caribbean (excluding high income)Latin America & the Caribbean (IDA & IBRD countries)LatviaLeast developed countries: UN classificationLebanonLesothoLiberiaLibyaLithuaniaLow & middle incomeLow incomeLower middle incomeLuxembourgMacao SAR, ChinaMacedonia, FYRMadagascarMalawiMalaysiaMaldivesMaliMaltaMauritaniaMauritiusMexicoMiddle East & North AfricaMiddle East & North Africa (excluding high income)Middle East & North Africa (IDA & IBRD countries)Middle incomeMoldovaMongoliaMontenegroMoroccoMozambiqueMyanmarNamibiaNepalNetherlandsNew CaledoniaNew ZealandNicaraguaNigerNigeriaNorth AmericaNorwayOECD membersOmanOther small statesPacific island small statesPakistanPalauPanamaPapua New GuineaParaguayPeruPhilippinesPolandPortugalPost-demographic dividendPre-demographic dividendQatarRomaniaRussian FederationRwandaSamoaSao Tome and PrincipeSaudi ArabiaSenegalSerbiaSeychellesSierra LeoneSingaporeSint Maarten (Dutch part)Slovak RepublicSloveniaSmall statesSolomon IslandsSouth AfricaSouth AsiaSouth Asia (IDA & IBRD)South SudanSpainSri LankaSt. Kitts and NevisSt. LuciaSt. Vincent and the GrenadinesSub-Saharan Africa Sub-Saharan Africa (excluding high income)Sub-Saharan Africa (IDA & IBRD countries)SudanSurinameSwazilandSwedenSwitzerlandSyrian Arab RepublicTajikistanTanzaniaThailandTimor-LesteTogoTongaTrinidad and TobagoTunisiaTurkeyTuvaluUgandaUkraineUnited KingdomUnited StatesUpper middle incomeUruguayVanuatuVenezuela, RBWest Bank and GazaWorldZambiaZimbabwe Linha do tempo:
Nesta escala de tempo está apresentado um gráfico de 1976 ano até 2016 ano Portugal. Dados de 1975 ano ausente. O número de observações reais por data: 41.
Fonte (nome):
Indicadores de desenvolvimento mundial
Fonte (organização):
International Monetary Fund, Balance of Payments Statistics Yearbook and data files.
Categorias:
Private Sector, Trade
Foi atualizado:
23 abr 2017 ano
Indicadores de alterações dos valores ao longo dos anos
Mínimo:
0.53
1 jan 1993 ano
Máximo:
7.676
1 jan 2001 ano
Na data de observação
Valor
Mudança absoluta
A alteração em relação ao valor anterior
1 jan 1976 ano
3.175
+3.175
0.0%
1 jan 1977 ano
2.385
-0.789
-24.86%
1 jan 1978 ano
1.453
-0.932
-39.08%
1 jan 1979 ano
1.722
+0.269
18.51%
1 jan 1980 ano
1.353
-0.37
-21.46%
1 jan 1981 ano
1.249
-0.104
-7.69%
1 jan 1982 ano
1.217
-0.032
-2.53%
1 jan 1983 ano
1.162
-0.055
-4.55%
1 jan 1984 ano
1.349
+0.187
16.11%
1 jan 1985 ano
1.022
-0.327
-24.21%
1 jan 1986 ano
0.872
-0.15
-14.71%
1 jan 1987 ano
0.733
-0.139
-15.92%
1 jan 1988 ano
0.659
-0.074
-10.09%
1 jan 1989 ano
0.855
+0.196
29.79%
1 jan 1990 ano
0.776
-0.08
-9.33%
1 jan 1991 ano
0.694
-0.081
-10.46%
1 jan 1992 ano
1.084
+0.389
56.02%
1 jan 1993 ano
0.53
-0.554
-51.13%
1 jan 1994 ano
2.846
+2.317
437.48%
1 jan 1995 ano
3.017
+0.17
5.99%
1 jan 1996 ano
4.411
+1.395
46.24%
1 jan 1997 ano
3.593
-0.818
-18.55%
1 jan 1998 ano
3.317
-0.276
-7.68%
1 jan 1999 ano
2.883
-0.434
-13.09%
1 jan 2000 ano
6.99
+4.107
142.46%
1 jan 2001 ano
7.676
+0.687
9.82%
1 jan 2002 ano
3.247
-4.429
-57.7%
1 jan 2003 ano
3.162
-0.085
-2.61%
1 jan 2004 ano
3.057
-0.105
-3.32%
1 jan 2005 ano
3.357
+0.299
9.79%
1 jan 2006 ano
2.96
-0.396
-11.8%
1 jan 2007 ano
2.78
-0.18
-6.1%
1 jan 2008 ano
3.357
+0.577
20.77%
1 jan 2009 ano
3.351
-0.006
-0.18%
1 jan 2010 ano
2.667
-0.685
-20.43%
1 jan 2011 ano
2.328
-0.339
-12.71%
1 jan 2012 ano
2.126
-0.202
-8.67%
1 jan 2013 ano
2.723
+0.597
28.1%
1 jan 2014 ano
2.134
-0.59
-21.65%
1 jan 2015 ano
2.112
-0.022
-1.03%
1 jan 2016 ano
2.089
-0.023
-1.09%
Classificação de países por estatísticas atuais por anos


Comentários: