29
/pt/
pt
AIzaSyAYiBZKx7MnpbEhh9jyipgxe19OcubqV5w
April 1, 2024
59900
Sub-Saharan Africa (excluding high income)
SSA
false
2
1
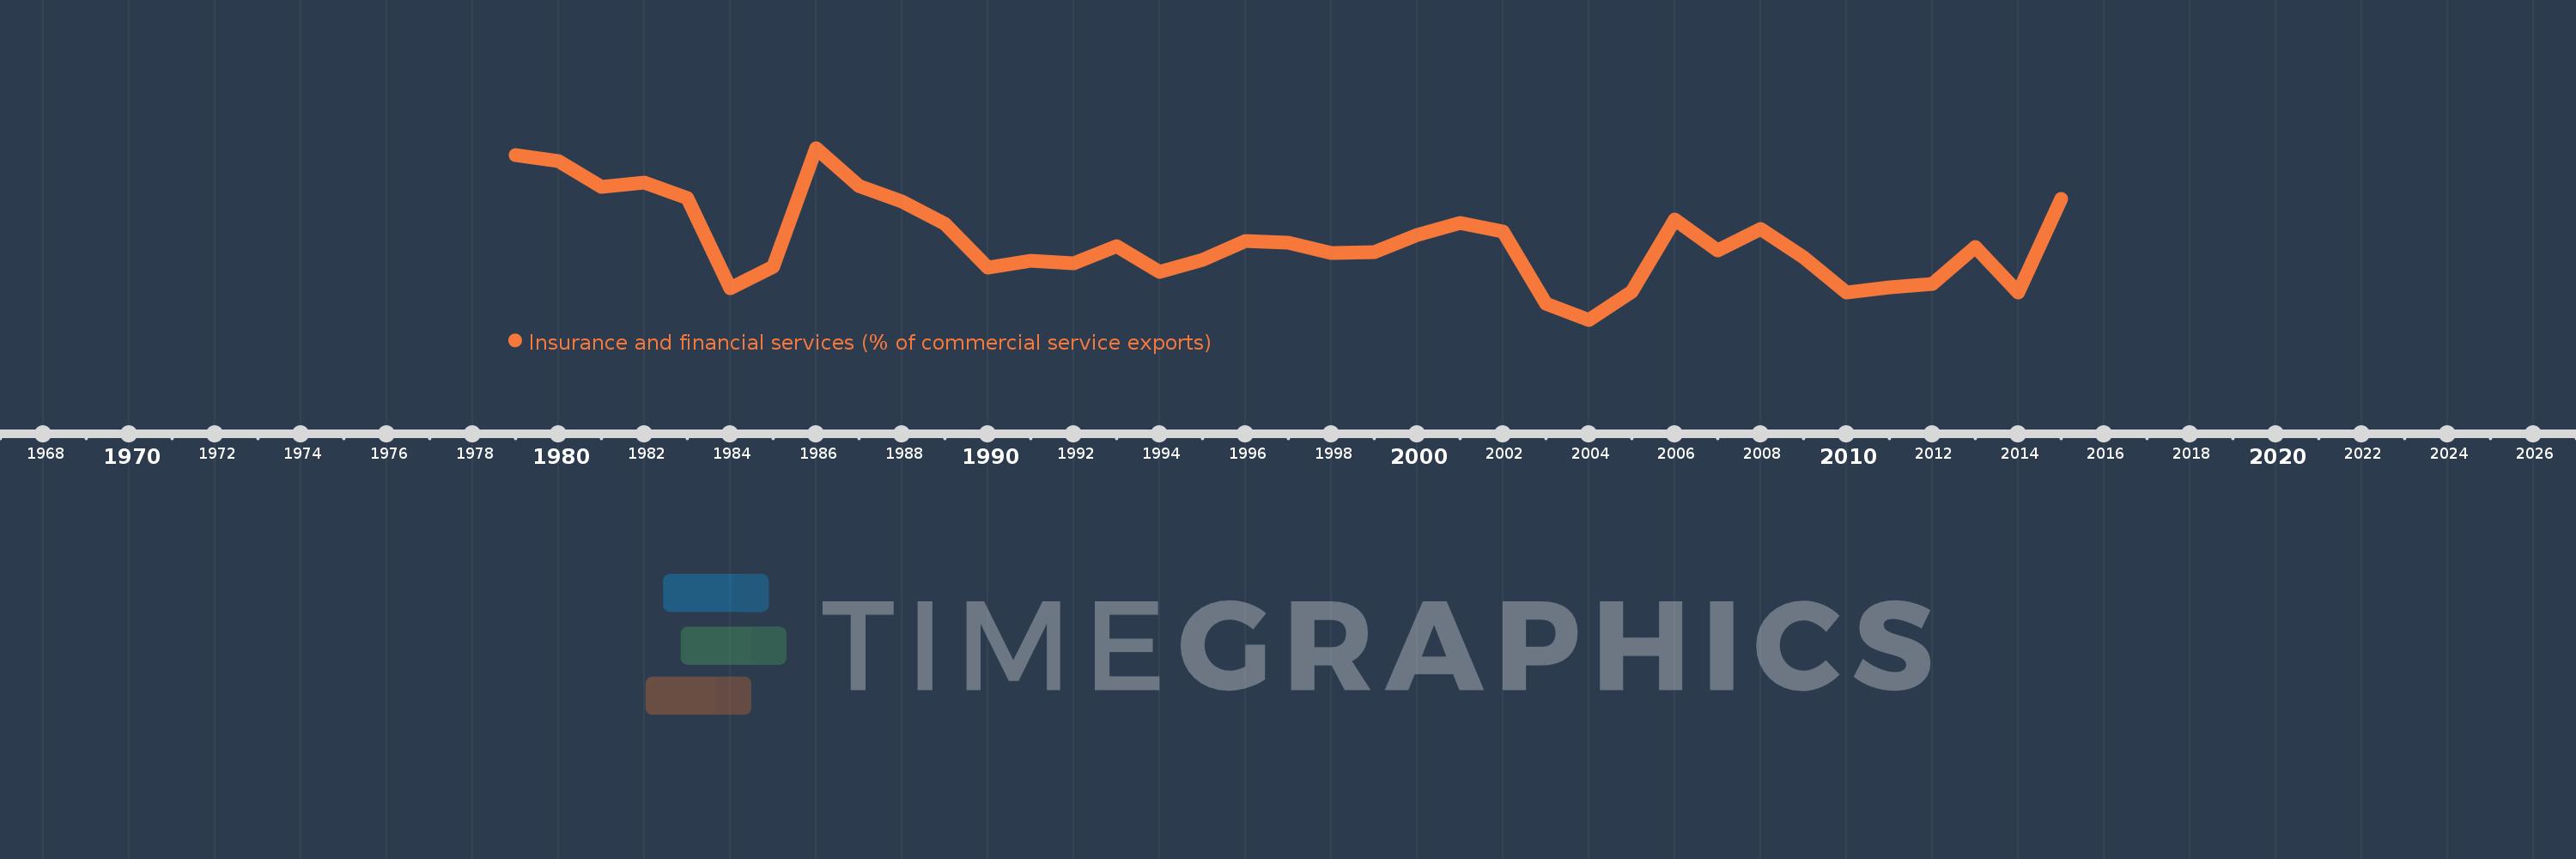
Insurance and financial services (% of commercial service exports)
2015,2014,2013,2012,2011,2010,2009,2008,2007,2006,2005,2004,2003,2002,2001,2000,1999,1998,1997,1996,1995,1994,1993,1992,1991,1990,1989,1988,1987,1986,1985,1984,1983,1982,1981,1980,1979
Estas estatísticas em outros países:
AfghanistanAlbaniaAlgeriaAngolaAntigua and BarbudaArab WorldArgentinaArmeniaArubaAustraliaAustriaAzerbaijanBahrainBangladeshBarbadosBelarusBelgiumBelizeBeninBermudaBhutanBoliviaBosnia and HerzegovinaBotswanaBrazilBrunei DarussalamBulgariaBurkina FasoBurundiCabo VerdeCambodiaCameroonCanadaCaribbean small statesCentral African RepublicCentral Europe and the BalticsChadChileChinaColombiaComorosCongo, Dem. Rep.Congo, Rep.Costa RicaCote d'IvoireCroatiaCuracaoCyprusCzech RepublicDenmarkDominicaDominican RepublicEarly-demographic dividendEast Asia & PacificEast Asia & Pacific (excluding high income)East Asia & Pacific (IDA & IBRD countries)EcuadorEgypt, Arab Rep.El SalvadorEritreaEstoniaEthiopiaEuro areaEurope & Central AsiaEurope & Central Asia (excluding high income)Europe & Central Asia (IDA & IBRD countries)European UnionFaroe IslandsFijiFinlandFragile and conflict affected situationsFranceFrench PolynesiaGabonGambia, TheGeorgiaGermanyGhanaGreeceGrenadaGuatemalaGuineaGuinea-BissauGuyanaHaitiHeavily indebted poor countries (HIPC)High incomeHondurasHong Kong SAR, ChinaHungaryIBRD onlyIcelandIDA & IBRD totalIDA onlyIDA totalIndiaIndonesiaIran, Islamic Rep.IraqIrelandIsraelItalyJamaicaJapanJordanKazakhstanKenyaKiribatiKorea, Rep.KosovoKuwaitKyrgyz RepublicLao PDRLate-demographic dividendLatin America & Caribbean Latin America & Caribbean (excluding high income)Latin America & the Caribbean (IDA & IBRD countries)LatviaLeast developed countries: UN classificationLebanonLesothoLiberiaLibyaLithuaniaLow & middle incomeLow incomeLower middle incomeLuxembourgMacao SAR, ChinaMacedonia, FYRMadagascarMalawiMalaysiaMaldivesMaliMaltaMauritaniaMauritiusMexicoMiddle East & North AfricaMiddle East & North Africa (excluding high income)Middle East & North Africa (IDA & IBRD countries)Middle incomeMoldovaMongoliaMontenegroMoroccoMozambiqueMyanmarNamibiaNepalNetherlandsNew CaledoniaNew ZealandNicaraguaNigerNigeriaNorth AmericaNorwayOECD membersOmanOther small statesPacific island small statesPakistanPalauPanamaPapua New GuineaParaguayPeruPhilippinesPolandPortugalPost-demographic dividendPre-demographic dividendQatarRomaniaRussian FederationRwandaSamoaSao Tome and PrincipeSaudi ArabiaSenegalSerbiaSeychellesSierra LeoneSingaporeSint Maarten (Dutch part)Slovak RepublicSloveniaSmall statesSolomon IslandsSouth AfricaSouth AsiaSouth Asia (IDA & IBRD)South SudanSpainSri LankaSt. Kitts and NevisSt. LuciaSt. Vincent and the GrenadinesSub-Saharan Africa Sub-Saharan Africa (excluding high income)Sub-Saharan Africa (IDA & IBRD countries)SudanSurinameSwazilandSwedenSwitzerlandSyrian Arab RepublicTajikistanTanzaniaThailandTimor-LesteTogoTongaTrinidad and TobagoTunisiaTurkeyTuvaluUgandaUkraineUnited KingdomUnited StatesUpper middle incomeUruguayVanuatuVenezuela, RBWest Bank and GazaWorldZambiaZimbabwe Linha do tempo:
Nesta escala de tempo está apresentado um gráfico de 1979 ano até 2015 ano Sub-Saharan Africa (excluding high income). Dados de 1978 ano ausente. O número de observações reais por data: 37.
Fonte (nome):
Indicadores de desenvolvimento mundial
Fonte (organização):
International Monetary Fund, Balance of Payments Statistics Yearbook and data files.
Categorias:
Private Sector, Trade
Foi atualizado:
23 abr 2017 ano
Indicadores de alterações dos valores ao longo dos anos
Mínimo:
3.489
1 jan 2004 ano
Máximo:
7.612
1 jan 1986 ano
Na data de observação
Valor
Mudança absoluta
A alteração em relação ao valor anterior
1 jan 1979 ano
7.451
+7.451
0.0%
1 jan 1980 ano
7.288
-0.163
-2.19%
1 jan 1981 ano
6.68
-0.607
-8.33%
1 jan 1982 ano
6.788
+0.108
1.62%
1 jan 1983 ano
6.415
-0.374
-5.5%
1 jan 1984 ano
4.245
-2.17
-33.82%
1 jan 1985 ano
4.751
+0.506
11.91%
1 jan 1986 ano
7.612
+2.861
60.23%
1 jan 1987 ano
6.696
-0.916
-12.03%
1 jan 1988 ano
6.33
-0.367
-5.48%
1 jan 1989 ano
5.783
-0.547
-8.64%
1 jan 1990 ano
4.748
-1.034
-17.88%
1 jan 1991 ano
4.905
+0.157
3.3%
1 jan 1992 ano
4.851
-0.054
-1.11%
1 jan 1993 ano
5.26
+0.409
8.43%
1 jan 1994 ano
4.628
-0.633
-12.03%
1 jan 1995 ano
4.923
+0.295
6.38%
1 jan 1996 ano
5.379
+0.456
9.27%
1 jan 1997 ano
5.331
-0.048
-0.89%
1 jan 1998 ano
5.083
-0.248
-4.66%
1 jan 1999 ano
5.118
+0.036
0.7%
1 jan 2000 ano
5.522
+0.404
7.89%
1 jan 2001 ano
5.81
+0.288
5.21%
1 jan 2002 ano
5.599
-0.211
-3.62%
1 jan 2003 ano
3.865
-1.735
-30.98%
1 jan 2004 ano
3.489
-0.376
-9.73%
1 jan 2005 ano
4.161
+0.673
19.28%
1 jan 2006 ano
5.895
+1.733
41.65%
1 jan 2007 ano
5.153
-0.741
-12.57%
1 jan 2008 ano
5.67
+0.517
10.03%
1 jan 2009 ano
4.994
-0.677
-11.93%
1 jan 2010 ano
4.152
-0.842
-16.86%
1 jan 2011 ano
4.259
+0.107
2.58%
1 jan 2012 ano
4.348
+0.089
2.1%
1 jan 2013 ano
5.237
+0.889
20.44%
1 jan 2014 ano
4.143
-1.094
-20.88%
1 jan 2015 ano
6.398
+2.255
54.42%
Classificação de países por estatísticas atuais por anos


Comentários: