29
/pt/
pt
AIzaSyAYiBZKx7MnpbEhh9jyipgxe19OcubqV5w
April 1, 2024
160626
Israel
ISR
true
2
1
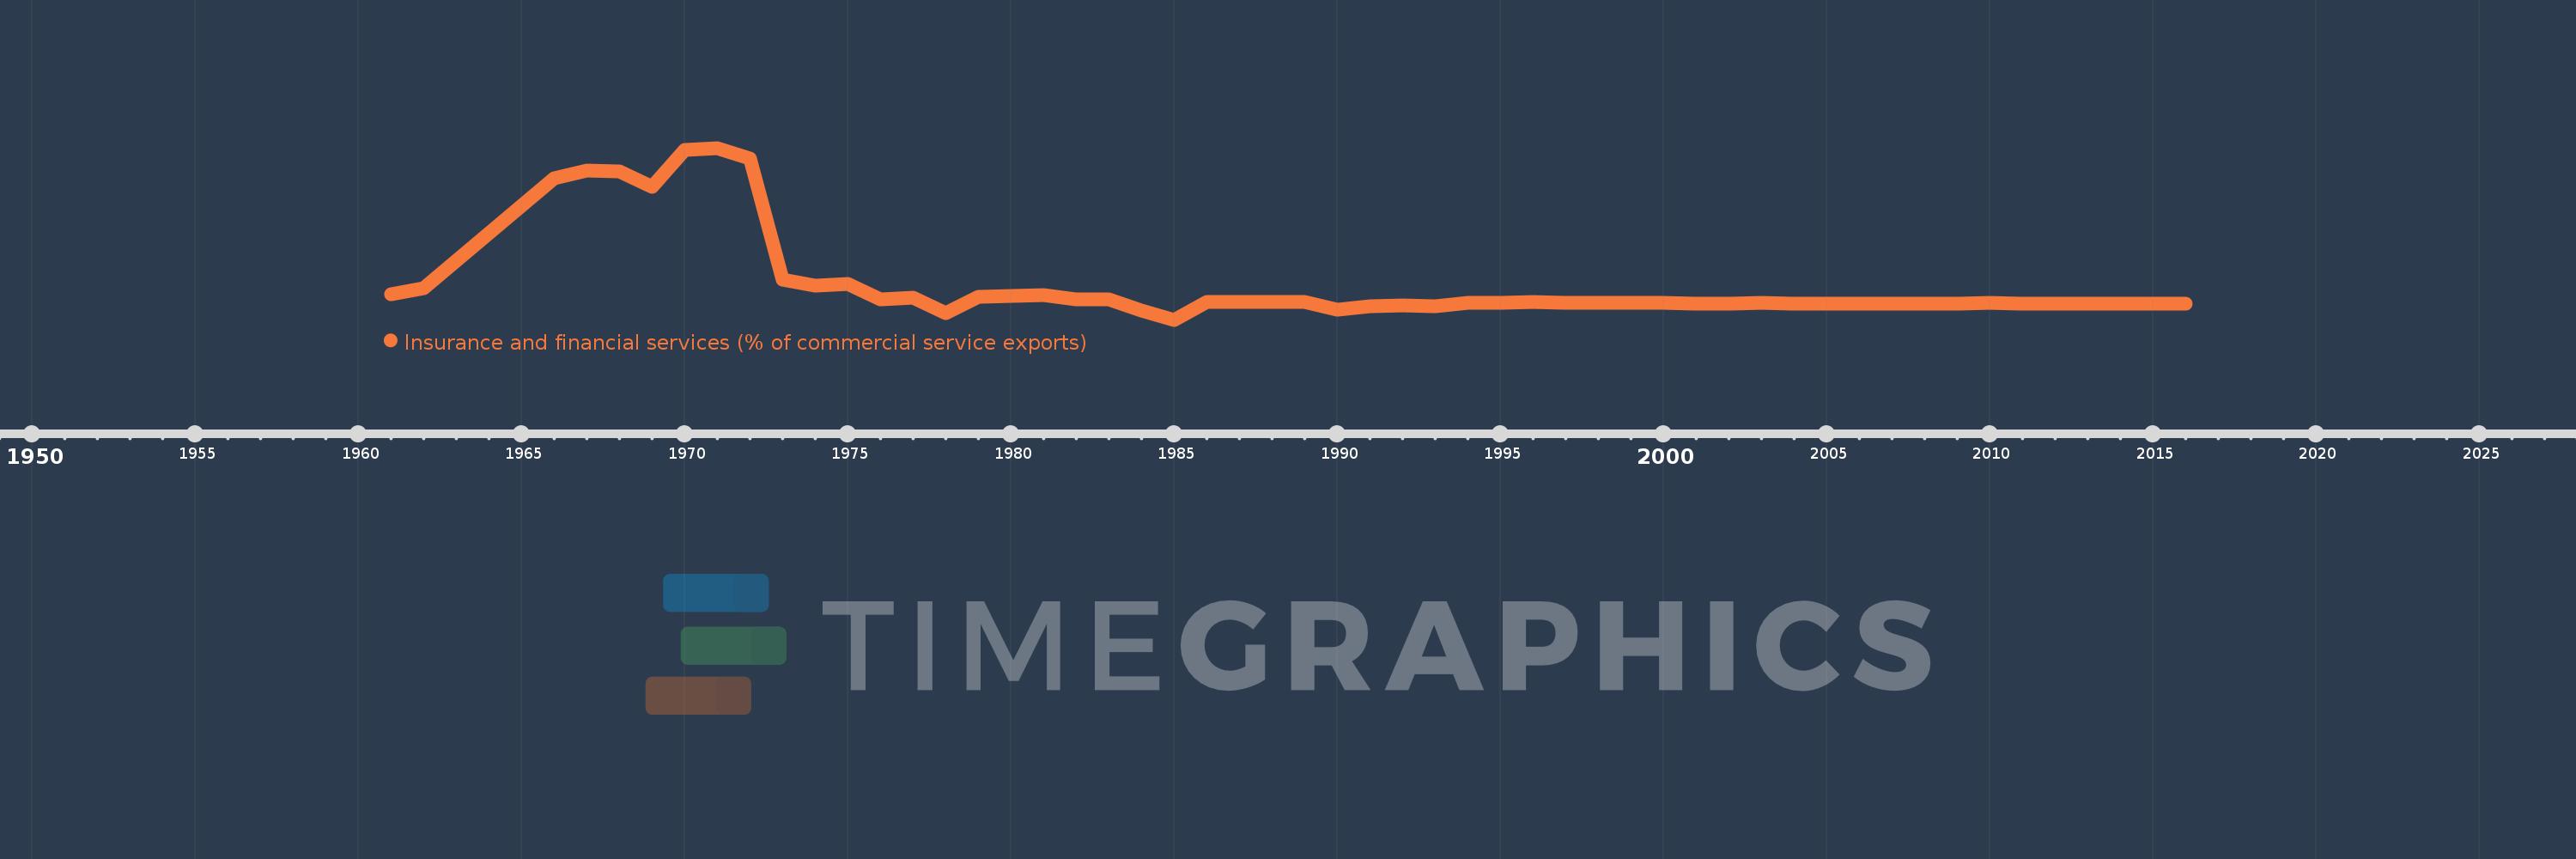
Insurance and financial services (% of commercial service exports)
2016,2015,2014,2013,2012,2011,2010,2009,2008,2007,2006,2005,2004,2003,2002,2001,2000,1999,1998,1997,1996,1995,1994,1993,1992,1991,1990,1989,1988,1987,1986,1985,1984,1983,1982,1981,1980,1979,1978,1977,1976,1975,1974,1973,1972,1971,1970,1969,1968,1967,1966,1962,1961
Estas estatísticas em outros países:
AfghanistanAlbaniaAlgeriaAngolaAntigua and BarbudaArab WorldArgentinaArmeniaArubaAustraliaAustriaAzerbaijanBahrainBangladeshBarbadosBelarusBelgiumBelizeBeninBermudaBhutanBoliviaBosnia and HerzegovinaBotswanaBrazilBrunei DarussalamBulgariaBurkina FasoBurundiCabo VerdeCambodiaCameroonCanadaCaribbean small statesCentral African RepublicCentral Europe and the BalticsChadChileChinaColombiaComorosCongo, Dem. Rep.Congo, Rep.Costa RicaCote d'IvoireCroatiaCuracaoCyprusCzech RepublicDenmarkDominicaDominican RepublicEarly-demographic dividendEast Asia & PacificEast Asia & Pacific (excluding high income)East Asia & Pacific (IDA & IBRD countries)EcuadorEgypt, Arab Rep.El SalvadorEritreaEstoniaEthiopiaEuro areaEurope & Central AsiaEurope & Central Asia (excluding high income)Europe & Central Asia (IDA & IBRD countries)European UnionFaroe IslandsFijiFinlandFragile and conflict affected situationsFranceFrench PolynesiaGabonGambia, TheGeorgiaGermanyGhanaGreeceGrenadaGuatemalaGuineaGuinea-BissauGuyanaHaitiHeavily indebted poor countries (HIPC)High incomeHondurasHong Kong SAR, ChinaHungaryIBRD onlyIcelandIDA & IBRD totalIDA onlyIDA totalIndiaIndonesiaIran, Islamic Rep.IraqIrelandIsraelItalyJamaicaJapanJordanKazakhstanKenyaKiribatiKorea, Rep.KosovoKuwaitKyrgyz RepublicLao PDRLate-demographic dividendLatin America & Caribbean Latin America & Caribbean (excluding high income)Latin America & the Caribbean (IDA & IBRD countries)LatviaLeast developed countries: UN classificationLebanonLesothoLiberiaLibyaLithuaniaLow & middle incomeLow incomeLower middle incomeLuxembourgMacao SAR, ChinaMacedonia, FYRMadagascarMalawiMalaysiaMaldivesMaliMaltaMauritaniaMauritiusMexicoMiddle East & North AfricaMiddle East & North Africa (excluding high income)Middle East & North Africa (IDA & IBRD countries)Middle incomeMoldovaMongoliaMontenegroMoroccoMozambiqueMyanmarNamibiaNepalNetherlandsNew CaledoniaNew ZealandNicaraguaNigerNigeriaNorth AmericaNorwayOECD membersOmanOther small statesPacific island small statesPakistanPalauPanamaPapua New GuineaParaguayPeruPhilippinesPolandPortugalPost-demographic dividendPre-demographic dividendQatarRomaniaRussian FederationRwandaSamoaSao Tome and PrincipeSaudi ArabiaSenegalSerbiaSeychellesSierra LeoneSingaporeSint Maarten (Dutch part)Slovak RepublicSloveniaSmall statesSolomon IslandsSouth AfricaSouth AsiaSouth Asia (IDA & IBRD)South SudanSpainSri LankaSt. Kitts and NevisSt. LuciaSt. Vincent and the GrenadinesSub-Saharan Africa Sub-Saharan Africa (excluding high income)Sub-Saharan Africa (IDA & IBRD countries)SudanSurinameSwazilandSwedenSwitzerlandSyrian Arab RepublicTajikistanTanzaniaThailandTimor-LesteTogoTongaTrinidad and TobagoTunisiaTurkeyTuvaluUgandaUkraineUnited KingdomUnited StatesUpper middle incomeUruguayVanuatuVenezuela, RBWest Bank and GazaWorldZambiaZimbabwe Linha do tempo:
Nesta escala de tempo está apresentado um gráfico de 1961 ano até 2016 ano Israel. Dados de 1960 ano ausente. O número de observações reais por data: 53.
Fonte (nome):
Indicadores de desenvolvimento mundial
Fonte (organização):
International Monetary Fund, Balance of Payments Statistics Yearbook and data files.
Categorias:
Private Sector, Trade
Foi atualizado:
23 abr 2017 ano
Indicadores de alterações dos valores ao longo dos anos
Mínimo:
-1.702
1 jan 1985 ano
Máximo:
17.308
1 jan 1971 ano
Na data de observação
Valor
Mudança absoluta
A alteração em relação ao valor anterior
1 jan 1961 ano
1.124
+1.124
0.0%
1 jan 1962 ano
1.77
+0.646
57.52%
1 jan 1966 ano
13.934
+12.165
687.3%
1 jan 1967 ano
14.855
+0.921
6.61%
1 jan 1968 ano
14.685
-0.17
-1.14%
1 jan 1969 ano
13.01
-1.675
-11.41%
1 jan 1970 ano
17.062
+4.051
31.14%
1 jan 1971 ano
17.308
+0.246
1.44%
1 jan 1972 ano
16.168
-1.14
-6.59%
1 jan 1973 ano
2.714
-13.453
-83.21%
1 jan 1974 ano
2.051
-0.664
-24.45%
1 jan 1975 ano
2.244
+0.194
9.44%
1 jan 1976 ano
0.544
-1.7
-75.74%
1 jan 1977 ano
0.759
+0.215
39.46%
1 jan 1978 ano
-1.01
-1.769
-233.03%
1 jan 1979 ano
0.827
+1.837
-181.9%
1 jan 1980 ano
0.957
+0.13
15.67%
1 jan 1981 ano
0.997
+0.04
4.23%
1 jan 1982 ano
0.542
-0.455
-45.62%
1 jan 1983 ano
0.592
+0.05
9.2%
1 jan 1984 ano
-0.705
-1.297
-218.94%
1 jan 1985 ano
-1.702
-0.997
141.56%
1 jan 1986 ano
0.238
+1.94
-113.97%
1 jan 1987 ano
0.253
+0.015
6.48%
1 jan 1988 ano
0.274
+0.021
8.44%
1 jan 1989 ano
0.221
-0.053
-19.38%
1 jan 1990 ano
-0.545
-0.766
-346.1%
1 jan 1991 ano
-0.246
+0.298
-54.75%
1 jan 1992 ano
-0.09
+0.156
-63.32%
1 jan 1993 ano
-0.235
-0.145
160.31%
1 jan 1994 ano
0.217
+0.452
-192.3%
1 jan 1995 ano
0.189
-0.028
-12.81%
1 jan 1996 ano
0.221
+0.032
16.9%
1 jan 1997 ano
0.153
-0.068
-30.73%
1 jan 1998 ano
0.164
+0.011
7.24%
1 jan 1999 ano
0.167
+0.002
1.36%
1 jan 2000 ano
0.146
-0.021
-12.56%
1 jan 2001 ano
0.108
-0.038
-26.2%
1 jan 2002 ano
0.106
-0.002
-1.6%
1 jan 2003 ano
0.127
+0.021
20.11%
1 jan 2004 ano
0.119
-0.008
-6.62%
1 jan 2005 ano
0.071
-0.048
-40.35%
1 jan 2006 ano
0.092
+0.021
30.06%
1 jan 2007 ano
0.108
+0.016
17.04%
1 jan 2008 ano
0.118
+0.011
9.83%
1 jan 2009 ano
0.106
-0.012
-10.49%
1 jan 2010 ano
0.128
+0.022
21.13%
1 jan 2011 ano
0.118
-0.01
-7.8%
1 jan 2012 ano
0.104
-0.014
-11.83%
1 jan 2013 ano
0.087
-0.017
-16.15%
1 jan 2014 ano
0.085
-0.002
-2.67%
1 jan 2015 ano
0.081
-0.004
-4.69%
1 jan 2016 ano
0.097
+0.016
19.81%
Classificação de países por estatísticas atuais por anos


Comentários: