29
/pt/
pt
AIzaSyAYiBZKx7MnpbEhh9jyipgxe19OcubqV5w
April 1, 2024
77793
Bangladesh
BGD
true
2
1
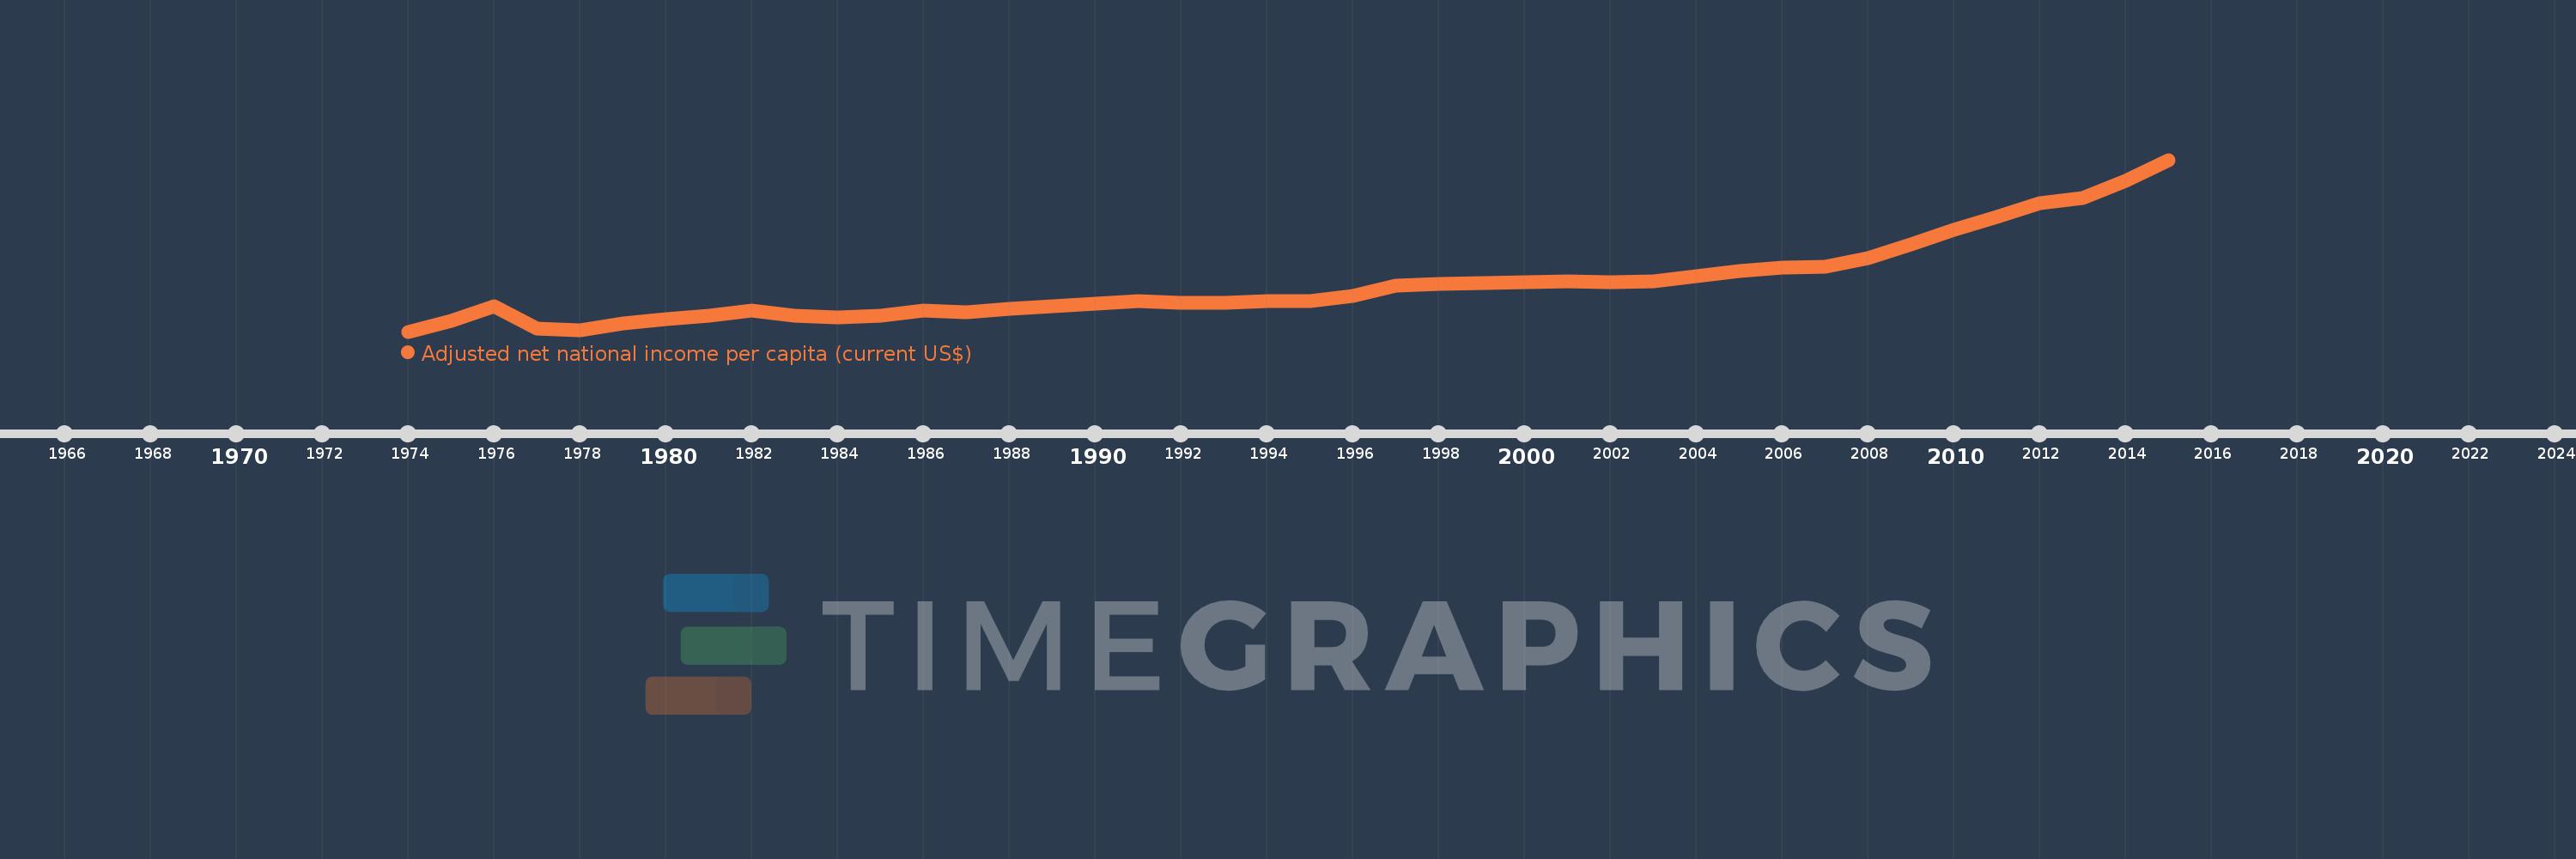
Adjusted net national income per capita (current US$)
2015,2014,2013,2012,2011,2010,2009,2008,2007,2006,2005,2004,2003,2002,2001,2000,1999,1998,1997,1996,1995,1994,1993,1992,1991,1990,1989,1988,1987,1986,1985,1984,1983,1982,1981,1980,1979,1978,1977,1976,1975,1974
Estas estatísticas em outros países:
AfghanistanAlbaniaAlgeriaAngolaArab WorldArgentinaArmeniaAustraliaAustriaAzerbaijanBahamas, TheBahrainBangladeshBarbadosBelarusBelgiumBelizeBeninBhutanBoliviaBotswanaBrazilBrunei DarussalamBulgariaBurkina FasoBurundiCabo VerdeCambodiaCameroonCanadaCaribbean small statesCentral African RepublicCentral Europe and the BalticsChadChileChinaColombiaComorosCongo, Dem. Rep.Congo, Rep.Costa RicaCote d'IvoireCroatiaCubaCyprusCzech RepublicDenmarkDjiboutiDominicaDominican RepublicEarly-demographic dividendEast Asia & PacificEast Asia & Pacific (excluding high income)East Asia & Pacific (IDA & IBRD countries)EcuadorEgypt, Arab Rep.El SalvadorEquatorial GuineaEritreaEstoniaEthiopiaEuro areaEurope & Central AsiaEurope & Central Asia (excluding high income)Europe & Central Asia (IDA & IBRD countries)European UnionFijiFinlandFragile and conflict affected situationsFranceGabonGambia, TheGeorgiaGermanyGhanaGreeceGuatemalaGuineaGuinea-BissauGuyanaHaitiHeavily indebted poor countries (HIPC)High incomeHondurasHong Kong SAR, ChinaHungaryIBRD onlyIcelandIDA & IBRD totalIDA blendIDA onlyIDA totalIndiaIndonesiaIran, Islamic Rep.IraqIrelandIsraelItalyJamaicaJapanJordanKazakhstanKenyaKiribatiKorea, Rep.KuwaitKyrgyz RepublicLao PDRLate-demographic dividendLatin America & Caribbean Latin America & Caribbean (excluding high income)Latin America & the Caribbean (IDA & IBRD countries)LatviaLeast developed countries: UN classificationLebanonLesothoLiberiaLibyaLithuaniaLow & middle incomeLow incomeLower middle incomeLuxembourgMacedonia, FYRMadagascarMalawiMalaysiaMaldivesMaliMauritaniaMauritiusMexicoMiddle East & North AfricaMiddle East & North Africa (excluding high income)Middle East & North Africa (IDA & IBRD countries)Middle incomeMoldovaMongoliaMoroccoMozambiqueMyanmarNamibiaNepalNetherlandsNew ZealandNicaraguaNigerNigeriaNorth AmericaNorwayOECD membersOmanOther small statesPacific island small statesPakistanPanamaPapua New GuineaParaguayPeruPhilippinesPolandPortugalPost-demographic dividendPre-demographic dividendQatarRomaniaRussian FederationRwandaSamoaSao Tome and PrincipeSaudi ArabiaSenegalSeychellesSierra LeoneSingaporeSlovak RepublicSloveniaSmall statesSolomon IslandsSouth AfricaSouth AsiaSouth Asia (IDA & IBRD)SpainSri LankaSt. LuciaSt. Vincent and the GrenadinesSub-Saharan Africa Sub-Saharan Africa (excluding high income)Sub-Saharan Africa (IDA & IBRD countries)SudanSurinameSwazilandSwedenSwitzerlandSyrian Arab RepublicTajikistanTanzaniaThailandTogoTongaTrinidad and TobagoTunisiaTurkeyTurkmenistanUgandaUkraineUnited Arab EmiratesUnited KingdomUnited StatesUpper middle incomeUruguayUzbekistanVanuatuVenezuela, RBVietnamWorldYemen, Rep.ZambiaZimbabwe Linha do tempo:
Nesta escala de tempo está apresentado um gráfico de 1974 ano até 2015 ano Bangladesh. Dados de 1973 ano ausente. O número de observações reais por data: 42.
Fonte (nome):
Indicadores de desenvolvimento mundial
Fonte (organização):
World Bank staff estimates based on sources and methods in World Bank's "The Changing Wealth of Nations: Measuring Sustainable Development in the New Millennium" (2011).
Categorias:
Economy & Growth
Foi atualizado:
23 abr 2017 ano
Indicadores de alterações dos valores ao longo dos anos
Mínimo:
106.774
1 jan 1974 ano
Máximo:
1.035 mil
1 jan 2015 ano
Na data de observação
Valor
Mudança absoluta
A alteração em relação ao valor anterior
1 jan 1974 ano
106.774
+106.774
0.0%
1 jan 1975 ano
163.605
+56.831
53.23%
1 jan 1976 ano
244.921
+81.316
49.7%
1 jan 1977 ano
123.703
-121.218
-49.49%
1 jan 1978 ano
112.735
-10.968
-8.87%
1 jan 1979 ano
152.899
+40.164
35.63%
1 jan 1980 ano
174.38
+21.481
14.05%
1 jan 1981 ano
191.036
+16.656
9.55%
1 jan 1982 ano
220.822
+29.785
15.59%
1 jan 1983 ano
193.517
-27.305
-12.36%
1 jan 1984 ano
183.85
-9.667
-5.0%
1 jan 1985 ano
193.163
+9.313
5.07%
1 jan 1986 ano
220.95
+27.787
14.39%
1 jan 1987 ano
209.051
-11.899
-5.39%
1 jan 1988 ano
228.769
+19.717
9.43%
1 jan 1989 ano
243.079
+14.31
6.26%
1 jan 1990 ano
257.241
+14.162
5.83%
1 jan 1991 ano
273.488
+16.247
6.32%
1 jan 1992 ano
261.781
-11.707
-4.28%
1 jan 1993 ano
262.835
+1.054
0.4%
1 jan 1994 ano
270.644
+7.809
2.97%
1 jan 1995 ano
271.266
+0.622
0.23%
1 jan 1996 ano
297.602
+26.336
9.71%
1 jan 1997 ano
355.537
+57.935
19.47%
1 jan 1998 ano
363.968
+8.431
2.37%
1 jan 1999 ano
369.77
+5.801
1.59%
1 jan 2000 ano
372.743
+2.973
0.8%
1 jan 2001 ano
378.541
+5.798
1.56%
1 jan 2002 ano
374.474
-4.067
-1.07%
1 jan 2003 ano
377.726
+3.252
0.87%
1 jan 2004 ano
406.182
+28.456
7.53%
1 jan 2005 ano
433.684
+27.502
6.77%
1 jan 2006 ano
451.464
+17.78
4.1%
1 jan 2007 ano
459.401
+7.938
1.76%
1 jan 2008 ano
504.858
+45.457
9.89%
1 jan 2009 ano
576.361
+71.503
14.16%
1 jan 2010 ano
656.494
+80.133
13.9%
1 jan 2011 ano
727.509
+71.015
10.82%
1 jan 2012 ano
801.95
+74.441
10.23%
1 jan 2013 ano
830.34
+28.391
3.54%
1 jan 2014 ano
920.607
+90.267
10.87%
1 jan 2015 ano
1.035 mil
+114.212
12.41%
Classificação de países por estatísticas atuais por anos


Comentários: