29
/pt/
pt
AIzaSyAYiBZKx7MnpbEhh9jyipgxe19OcubqV5w
April 1, 2024
26261
Early-demographic dividend
EAR
false
2
1
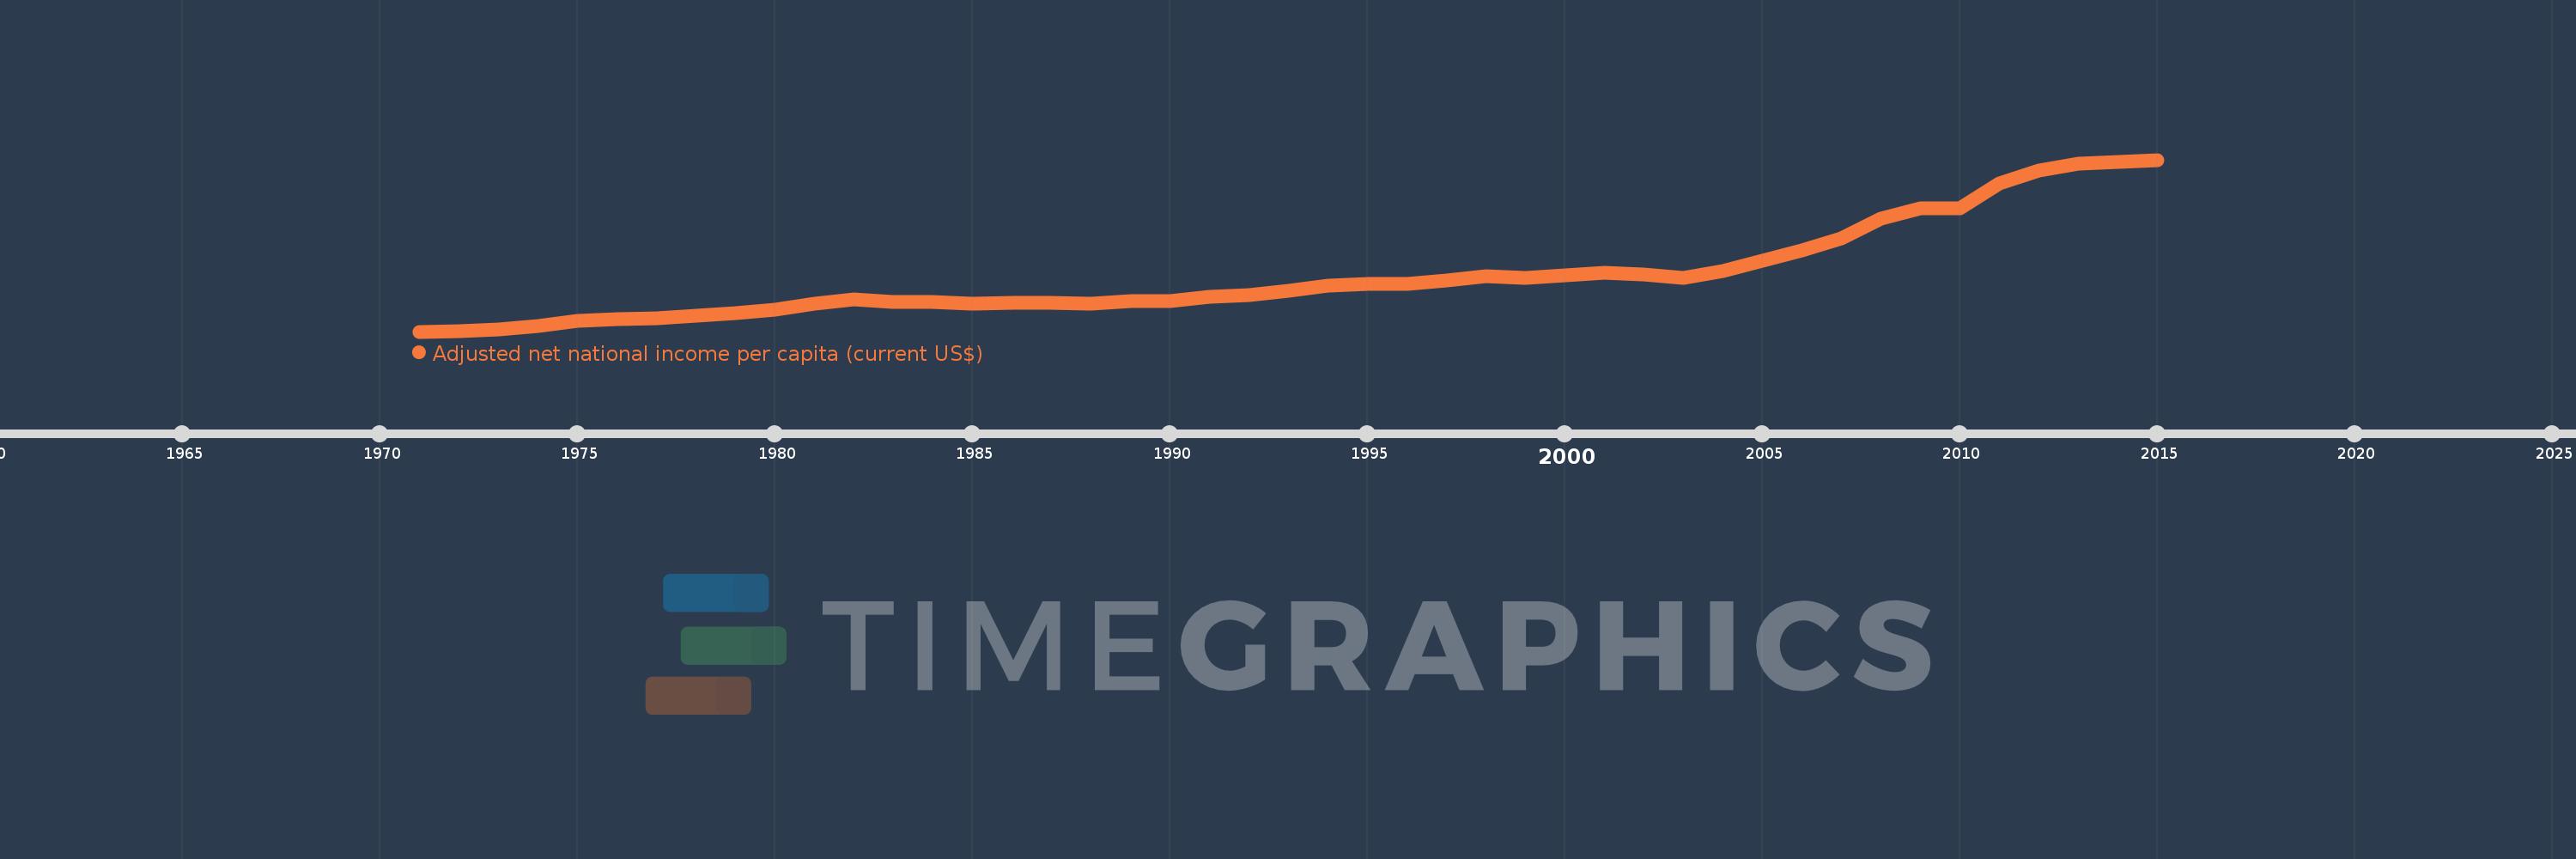
Adjusted net national income per capita (current US$)
2015,2014,2013,2012,2011,2010,2009,2008,2007,2006,2005,2004,2003,2002,2001,2000,1999,1998,1997,1996,1995,1994,1993,1992,1991,1990,1989,1988,1987,1986,1985,1984,1983,1982,1981,1980,1979,1978,1977,1976,1975,1974,1973,1972,1971
Estas estatísticas em outros países:
AfghanistanAlbaniaAlgeriaAngolaArab WorldArgentinaArmeniaAustraliaAustriaAzerbaijanBahamas, TheBahrainBangladeshBarbadosBelarusBelgiumBelizeBeninBhutanBoliviaBotswanaBrazilBrunei DarussalamBulgariaBurkina FasoBurundiCabo VerdeCambodiaCameroonCanadaCaribbean small statesCentral African RepublicCentral Europe and the BalticsChadChileChinaColombiaComorosCongo, Dem. Rep.Congo, Rep.Costa RicaCote d'IvoireCroatiaCubaCyprusCzech RepublicDenmarkDjiboutiDominicaDominican RepublicEarly-demographic dividendEast Asia & PacificEast Asia & Pacific (excluding high income)East Asia & Pacific (IDA & IBRD countries)EcuadorEgypt, Arab Rep.El SalvadorEquatorial GuineaEritreaEstoniaEthiopiaEuro areaEurope & Central AsiaEurope & Central Asia (excluding high income)Europe & Central Asia (IDA & IBRD countries)European UnionFijiFinlandFragile and conflict affected situationsFranceGabonGambia, TheGeorgiaGermanyGhanaGreeceGuatemalaGuineaGuinea-BissauGuyanaHaitiHeavily indebted poor countries (HIPC)High incomeHondurasHong Kong SAR, ChinaHungaryIBRD onlyIcelandIDA & IBRD totalIDA blendIDA onlyIDA totalIndiaIndonesiaIran, Islamic Rep.IraqIrelandIsraelItalyJamaicaJapanJordanKazakhstanKenyaKiribatiKorea, Rep.KuwaitKyrgyz RepublicLao PDRLate-demographic dividendLatin America & Caribbean Latin America & Caribbean (excluding high income)Latin America & the Caribbean (IDA & IBRD countries)LatviaLeast developed countries: UN classificationLebanonLesothoLiberiaLibyaLithuaniaLow & middle incomeLow incomeLower middle incomeLuxembourgMacedonia, FYRMadagascarMalawiMalaysiaMaldivesMaliMauritaniaMauritiusMexicoMiddle East & North AfricaMiddle East & North Africa (excluding high income)Middle East & North Africa (IDA & IBRD countries)Middle incomeMoldovaMongoliaMoroccoMozambiqueMyanmarNamibiaNepalNetherlandsNew ZealandNicaraguaNigerNigeriaNorth AmericaNorwayOECD membersOmanOther small statesPacific island small statesPakistanPanamaPapua New GuineaParaguayPeruPhilippinesPolandPortugalPost-demographic dividendPre-demographic dividendQatarRomaniaRussian FederationRwandaSamoaSao Tome and PrincipeSaudi ArabiaSenegalSeychellesSierra LeoneSingaporeSlovak RepublicSloveniaSmall statesSolomon IslandsSouth AfricaSouth AsiaSouth Asia (IDA & IBRD)SpainSri LankaSt. LuciaSt. Vincent and the GrenadinesSub-Saharan Africa Sub-Saharan Africa (excluding high income)Sub-Saharan Africa (IDA & IBRD countries)SudanSurinameSwazilandSwedenSwitzerlandSyrian Arab RepublicTajikistanTanzaniaThailandTogoTongaTrinidad and TobagoTunisiaTurkeyTurkmenistanUgandaUkraineUnited Arab EmiratesUnited KingdomUnited StatesUpper middle incomeUruguayUzbekistanVanuatuVenezuela, RBVietnamWorldYemen, Rep.ZambiaZimbabwe Linha do tempo:
Nesta escala de tempo está apresentado um gráfico de 1971 ano até 2015 ano Early-demographic dividend. Dados de 1970 ano ausente. O número de observações reais por data: 45.
Fonte (nome):
Indicadores de desenvolvimento mundial
Fonte (organização):
World Bank staff estimates based on sources and methods in World Bank's "The Changing Wealth of Nations: Measuring Sustainable Development in the New Millennium" (2011).
Categorias:
Economy & Growth
Foi atualizado:
23 abr 2017 ano
Indicadores de alterações dos valores ao longo dos anos
Mínimo:
193.989
1 jan 1971 ano
Máximo:
2.845 mil
1 jan 2015 ano
Na data de observação
Valor
Mudança absoluta
A alteração em relação ao valor anterior
1 jan 1971 ano
193.989
+193.989
0.0%
1 jan 1972 ano
206.283
+12.294
6.34%
1 jan 1973 ano
223.024
+16.741
8.12%
1 jan 1974 ano
274.824
+51.8
23.23%
1 jan 1975 ano
354.973
+80.149
29.16%
1 jan 1976 ano
379.895
+24.923
7.02%
1 jan 1977 ano
401.019
+21.124
5.56%
1 jan 1978 ano
436.086
+35.067
8.74%
1 jan 1979 ano
473.213
+37.128
8.51%
1 jan 1980 ano
527.461
+54.247
11.46%
1 jan 1981 ano
623.72
+96.26
18.25%
1 jan 1982 ano
697.605
+73.884
11.85%
1 jan 1983 ano
651.597
-46.008
-6.6%
1 jan 1984 ano
655.145
+3.548
0.54%
1 jan 1985 ano
628.947
-26.198
-4.0%
1 jan 1986 ano
635.488
+6.541
1.04%
1 jan 1987 ano
642.26
+6.773
1.07%
1 jan 1988 ano
626.964
-15.296
-2.38%
1 jan 1989 ano
664.788
+37.824
6.03%
1 jan 1990 ano
659.081
-5.707
-0.86%
1 jan 1991 ano
733.123
+74.042
11.23%
1 jan 1992 ano
761.178
+28.055
3.83%
1 jan 1993 ano
827.595
+66.417
8.73%
1 jan 1994 ano
905.117
+77.521
9.37%
1 jan 1995 ano
930.538
+25.421
2.81%
1 jan 1996 ano
923.497
-7.041
-0.76%
1 jan 1997 ano
986.976
+63.479
6.87%
1 jan 1998 ano
1.045 mil
+58.034
5.88%
1 jan 1999 ano
1.024 mil
-20.968
-2.01%
1 jan 2000 ano
1.056 mil
+31.503
3.08%
1 jan 2001 ano
1.098 mil
+42.025
3.98%
1 jan 2002 ano
1.073 mil
-24.711
-2.25%
1 jan 2003 ano
1.028 mil
-44.426
-4.14%
1 jan 2004 ano
1.124 mil
+95.709
9.31%
1 jan 2005 ano
1.284 mil
+159.536
14.19%
1 jan 2006 ano
1.452 mil
+167.868
13.08%
1 jan 2007 ano
1.637 mil
+184.97
12.74%
1 jan 2008 ano
1.936 mil
+299.921
18.33%
1 jan 2009 ano
2.102 mil
+165.827
8.56%
1 jan 2010 ano
2.089 mil
-12.875
-0.61%
1 jan 2011 ano
2.475 mil
+385.709
18.46%
1 jan 2012 ano
2.684 mil
+208.641
8.43%
1 jan 2013 ano
2.784 mil
+100.701
3.75%
1 jan 2014 ano
2.805 mil
+20.502
0.74%
1 jan 2015 ano
2.845 mil
+39.685
1.41%
Classificação de países por estatísticas atuais por anos


Comentários: