29
/pt/
pt
AIzaSyAYiBZKx7MnpbEhh9jyipgxe19OcubqV5w
April 1, 2024
146499
Guinea-Bissau
GNB
true
2
1
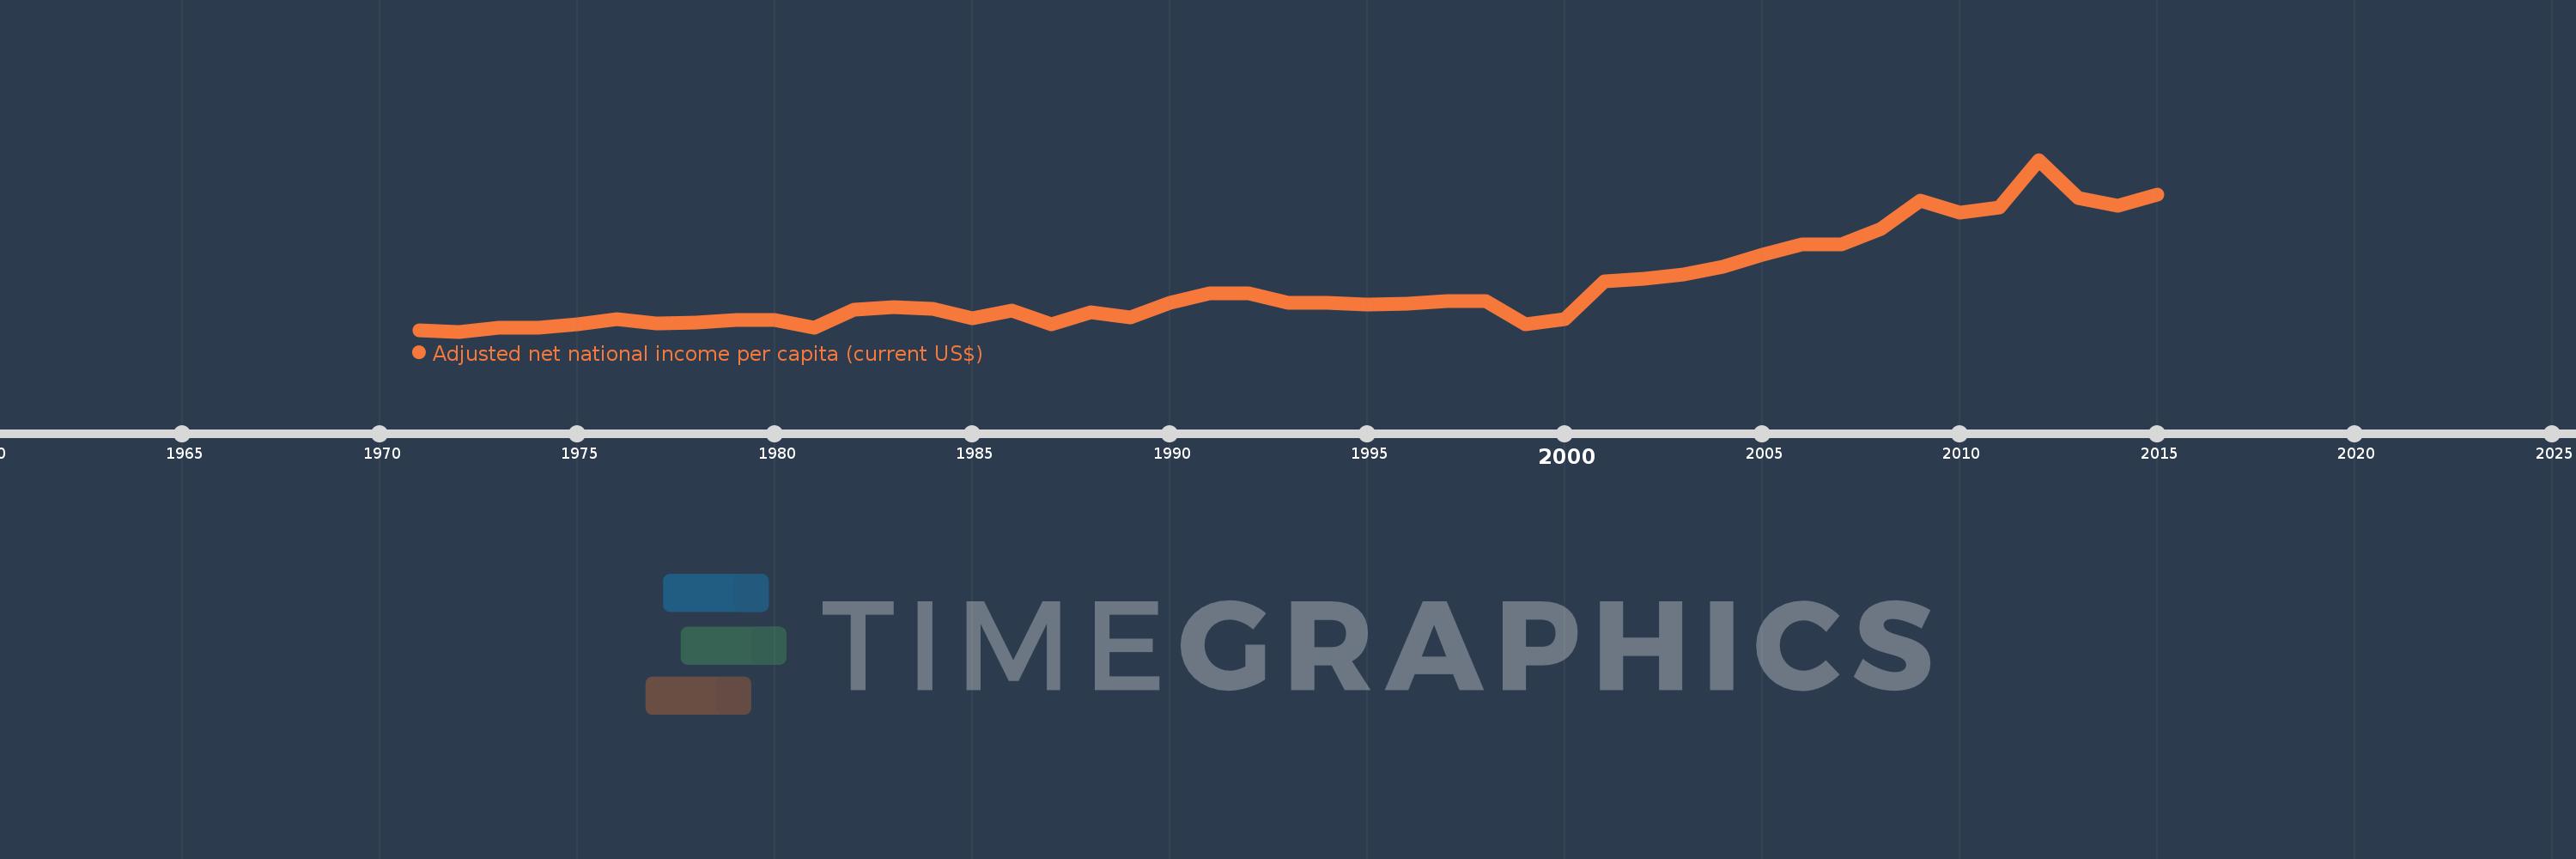
Adjusted net national income per capita (current US$)
2015,2014,2013,2012,2011,2010,2009,2008,2007,2006,2005,2004,2003,2002,2001,2000,1999,1998,1997,1996,1995,1994,1993,1992,1991,1990,1989,1988,1987,1986,1985,1984,1983,1982,1981,1980,1979,1978,1977,1976,1975,1974,1973,1972,1971
Estas estatísticas em outros países:
AfghanistanAlbaniaAlgeriaAngolaArab WorldArgentinaArmeniaAustraliaAustriaAzerbaijanBahamas, TheBahrainBangladeshBarbadosBelarusBelgiumBelizeBeninBhutanBoliviaBotswanaBrazilBrunei DarussalamBulgariaBurkina FasoBurundiCabo VerdeCambodiaCameroonCanadaCaribbean small statesCentral African RepublicCentral Europe and the BalticsChadChileChinaColombiaComorosCongo, Dem. Rep.Congo, Rep.Costa RicaCote d'IvoireCroatiaCubaCyprusCzech RepublicDenmarkDjiboutiDominicaDominican RepublicEarly-demographic dividendEast Asia & PacificEast Asia & Pacific (excluding high income)East Asia & Pacific (IDA & IBRD countries)EcuadorEgypt, Arab Rep.El SalvadorEquatorial GuineaEritreaEstoniaEthiopiaEuro areaEurope & Central AsiaEurope & Central Asia (excluding high income)Europe & Central Asia (IDA & IBRD countries)European UnionFijiFinlandFragile and conflict affected situationsFranceGabonGambia, TheGeorgiaGermanyGhanaGreeceGuatemalaGuineaGuinea-BissauGuyanaHaitiHeavily indebted poor countries (HIPC)High incomeHondurasHong Kong SAR, ChinaHungaryIBRD onlyIcelandIDA & IBRD totalIDA blendIDA onlyIDA totalIndiaIndonesiaIran, Islamic Rep.IraqIrelandIsraelItalyJamaicaJapanJordanKazakhstanKenyaKiribatiKorea, Rep.KuwaitKyrgyz RepublicLao PDRLate-demographic dividendLatin America & Caribbean Latin America & Caribbean (excluding high income)Latin America & the Caribbean (IDA & IBRD countries)LatviaLeast developed countries: UN classificationLebanonLesothoLiberiaLibyaLithuaniaLow & middle incomeLow incomeLower middle incomeLuxembourgMacedonia, FYRMadagascarMalawiMalaysiaMaldivesMaliMauritaniaMauritiusMexicoMiddle East & North AfricaMiddle East & North Africa (excluding high income)Middle East & North Africa (IDA & IBRD countries)Middle incomeMoldovaMongoliaMoroccoMozambiqueMyanmarNamibiaNepalNetherlandsNew ZealandNicaraguaNigerNigeriaNorth AmericaNorwayOECD membersOmanOther small statesPacific island small statesPakistanPanamaPapua New GuineaParaguayPeruPhilippinesPolandPortugalPost-demographic dividendPre-demographic dividendQatarRomaniaRussian FederationRwandaSamoaSao Tome and PrincipeSaudi ArabiaSenegalSeychellesSierra LeoneSingaporeSlovak RepublicSloveniaSmall statesSolomon IslandsSouth AfricaSouth AsiaSouth Asia (IDA & IBRD)SpainSri LankaSt. LuciaSt. Vincent and the GrenadinesSub-Saharan Africa Sub-Saharan Africa (excluding high income)Sub-Saharan Africa (IDA & IBRD countries)SudanSurinameSwazilandSwedenSwitzerlandSyrian Arab RepublicTajikistanTanzaniaThailandTogoTongaTrinidad and TobagoTunisiaTurkeyTurkmenistanUgandaUkraineUnited Arab EmiratesUnited KingdomUnited StatesUpper middle incomeUruguayUzbekistanVanuatuVenezuela, RBVietnamWorldYemen, Rep.ZambiaZimbabwe Linha do tempo:
Nesta escala de tempo está apresentado um gráfico de 1971 ano até 2015 ano Guinea-Bissau. Dados de 1970 ano ausente. O número de observações reais por data: 45.
Fonte (nome):
Indicadores de desenvolvimento mundial
Fonte (organização):
World Bank staff estimates based on sources and methods in World Bank's "The Changing Wealth of Nations: Measuring Sustainable Development in the New Millennium" (2011).
Categorias:
Economy & Growth
Foi atualizado:
23 abr 2017 ano
Indicadores de alterações dos valores ao longo dos anos
Mínimo:
96.975
1 jan 1972 ano
Máximo:
534.381
1 jan 2012 ano
Na data de observação
Valor
Mudança absoluta
A alteração em relação ao valor anterior
1 jan 1971 ano
100.312
+100.312
0.0%
1 jan 1972 ano
96.975
-3.337
-3.33%
1 jan 1973 ano
106.304
+9.329
9.62%
1 jan 1974 ano
105.982
-0.322
-0.3%
1 jan 1975 ano
115.17
+9.188
8.67%
1 jan 1976 ano
128.886
+13.716
11.91%
1 jan 1977 ano
118.734
-10.152
-7.88%
1 jan 1978 ano
120.176
+1.442
1.21%
1 jan 1979 ano
127.021
+6.845
5.7%
1 jan 1980 ano
125.856
-1.165
-0.92%
1 jan 1981 ano
106.992
-18.864
-14.99%
1 jan 1982 ano
152.788
+45.796
42.8%
1 jan 1983 ano
160.315
+7.527
4.93%
1 jan 1984 ano
155.866
-4.448
-2.77%
1 jan 1985 ano
130.623
-25.243
-16.2%
1 jan 1986 ano
149.524
+18.901
14.47%
1 jan 1987 ano
116.37
-33.154
-22.17%
1 jan 1988 ano
145.899
+29.529
25.37%
1 jan 1989 ano
134.064
-11.834
-8.11%
1 jan 1990 ano
170.733
+36.669
27.35%
1 jan 1991 ano
194.532
+23.799
13.94%
1 jan 1992 ano
195.258
+0.726
0.37%
1 jan 1993 ano
169.261
-25.997
-13.31%
1 jan 1994 ano
170.222
+0.961
0.57%
1 jan 1995 ano
165.097
-5.125
-3.01%
1 jan 1996 ano
168.948
+3.85
2.33%
1 jan 1997 ano
175.621
+6.673
3.95%
1 jan 1998 ano
173.652
-1.969
-1.12%
1 jan 1999 ano
115.316
-58.335
-33.59%
1 jan 2000 ano
129.184
+13.868
12.03%
1 jan 2001 ano
223.897
+94.713
73.32%
1 jan 2002 ano
230.957
+7.06
3.15%
1 jan 2003 ano
242.024
+11.068
4.79%
1 jan 2004 ano
262.056
+20.032
8.28%
1 jan 2005 ano
292.893
+30.837
11.77%
1 jan 2006 ano
318.961
+26.068
8.9%
1 jan 2007 ano
318.238
-0.723
-0.23%
1 jan 2008 ano
359.303
+41.065
12.9%
1 jan 2009 ano
431.001
+71.699
19.95%
1 jan 2010 ano
400.953
-30.048
-6.97%
1 jan 2011 ano
412.821
+11.868
2.96%
1 jan 2012 ano
534.381
+121.56
29.45%
1 jan 2013 ano
436.657
-97.725
-18.29%
1 jan 2014 ano
417.994
-18.663
-4.27%
1 jan 2015 ano
445.008
+27.015
6.46%
Classificação de países por estatísticas atuais por anos


Comentários: