29
/pt/
pt
AIzaSyAYiBZKx7MnpbEhh9jyipgxe19OcubqV5w
April 1, 2024
215971
Pakistan
PAK
true
2
1
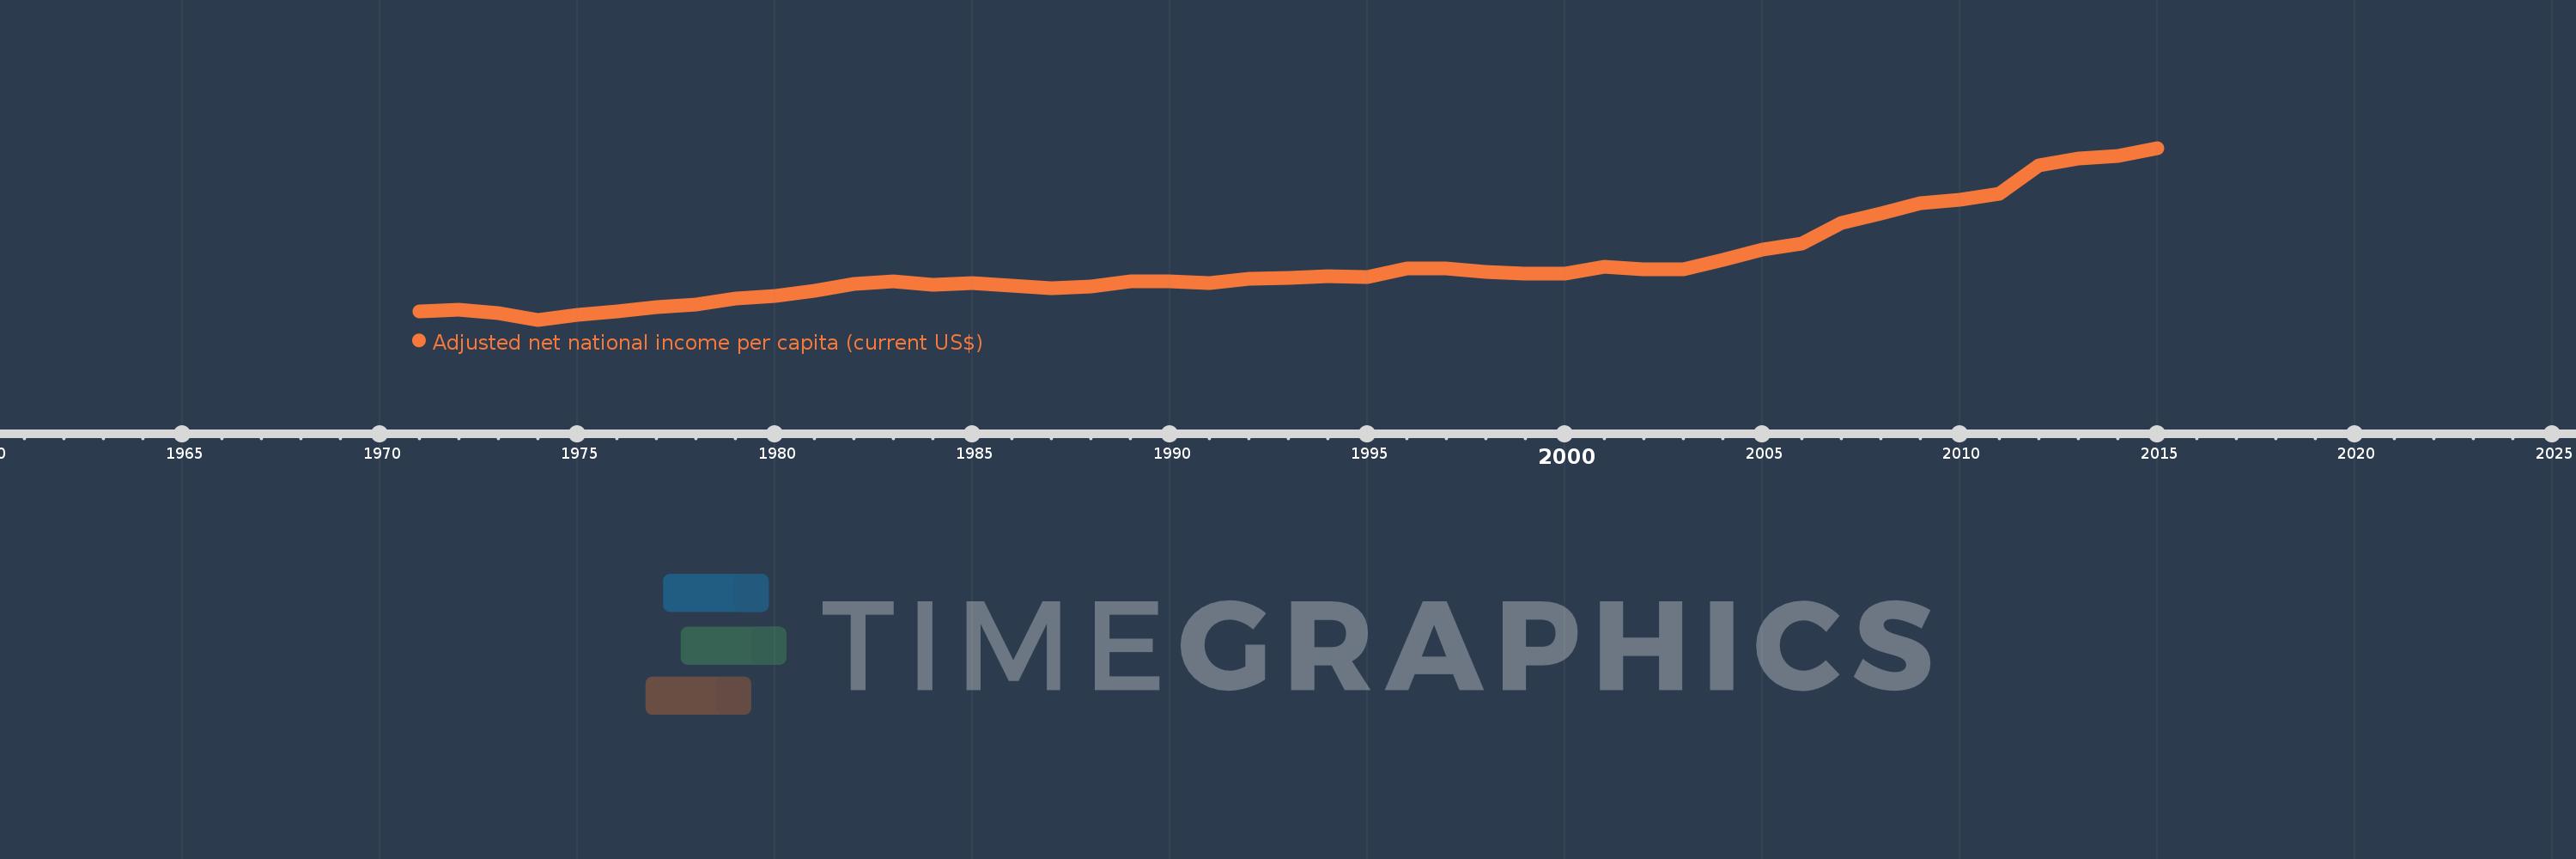
Adjusted net national income per capita (current US$)
2015,2014,2013,2012,2011,2010,2009,2008,2007,2006,2005,2004,2003,2002,2001,2000,1999,1998,1997,1996,1995,1994,1993,1992,1991,1990,1989,1988,1987,1986,1985,1984,1983,1982,1981,1980,1979,1978,1977,1976,1975,1974,1973,1972,1971
Estas estatísticas em outros países:
AfghanistanAlbaniaAlgeriaAngolaArab WorldArgentinaArmeniaAustraliaAustriaAzerbaijanBahamas, TheBahrainBangladeshBarbadosBelarusBelgiumBelizeBeninBhutanBoliviaBotswanaBrazilBrunei DarussalamBulgariaBurkina FasoBurundiCabo VerdeCambodiaCameroonCanadaCaribbean small statesCentral African RepublicCentral Europe and the BalticsChadChileChinaColombiaComorosCongo, Dem. Rep.Congo, Rep.Costa RicaCote d'IvoireCroatiaCubaCyprusCzech RepublicDenmarkDjiboutiDominicaDominican RepublicEarly-demographic dividendEast Asia & PacificEast Asia & Pacific (excluding high income)East Asia & Pacific (IDA & IBRD countries)EcuadorEgypt, Arab Rep.El SalvadorEquatorial GuineaEritreaEstoniaEthiopiaEuro areaEurope & Central AsiaEurope & Central Asia (excluding high income)Europe & Central Asia (IDA & IBRD countries)European UnionFijiFinlandFragile and conflict affected situationsFranceGabonGambia, TheGeorgiaGermanyGhanaGreeceGuatemalaGuineaGuinea-BissauGuyanaHaitiHeavily indebted poor countries (HIPC)High incomeHondurasHong Kong SAR, ChinaHungaryIBRD onlyIcelandIDA & IBRD totalIDA blendIDA onlyIDA totalIndiaIndonesiaIran, Islamic Rep.IraqIrelandIsraelItalyJamaicaJapanJordanKazakhstanKenyaKiribatiKorea, Rep.KuwaitKyrgyz RepublicLao PDRLate-demographic dividendLatin America & Caribbean Latin America & Caribbean (excluding high income)Latin America & the Caribbean (IDA & IBRD countries)LatviaLeast developed countries: UN classificationLebanonLesothoLiberiaLibyaLithuaniaLow & middle incomeLow incomeLower middle incomeLuxembourgMacedonia, FYRMadagascarMalawiMalaysiaMaldivesMaliMauritaniaMauritiusMexicoMiddle East & North AfricaMiddle East & North Africa (excluding high income)Middle East & North Africa (IDA & IBRD countries)Middle incomeMoldovaMongoliaMoroccoMozambiqueMyanmarNamibiaNepalNetherlandsNew ZealandNicaraguaNigerNigeriaNorth AmericaNorwayOECD membersOmanOther small statesPacific island small statesPakistanPanamaPapua New GuineaParaguayPeruPhilippinesPolandPortugalPost-demographic dividendPre-demographic dividendQatarRomaniaRussian FederationRwandaSamoaSao Tome and PrincipeSaudi ArabiaSenegalSeychellesSierra LeoneSingaporeSlovak RepublicSloveniaSmall statesSolomon IslandsSouth AfricaSouth AsiaSouth Asia (IDA & IBRD)SpainSri LankaSt. LuciaSt. Vincent and the GrenadinesSub-Saharan Africa Sub-Saharan Africa (excluding high income)Sub-Saharan Africa (IDA & IBRD countries)SudanSurinameSwazilandSwedenSwitzerlandSyrian Arab RepublicTajikistanTanzaniaThailandTogoTongaTrinidad and TobagoTunisiaTurkeyTurkmenistanUgandaUkraineUnited Arab EmiratesUnited KingdomUnited StatesUpper middle incomeUruguayUzbekistanVanuatuVenezuela, RBVietnamWorldYemen, Rep.ZambiaZimbabwe Linha do tempo:
Nesta escala de tempo está apresentado um gráfico de 1971 ano até 2015 ano Pakistan. Dados de 1970 ano ausente. O número de observações reais por data: 45.
Fonte (nome):
Indicadores de desenvolvimento mundial
Fonte (organização):
World Bank staff estimates based on sources and methods in World Bank's "The Changing Wealth of Nations: Measuring Sustainable Development in the New Millennium" (2011).
Categorias:
Economy & Growth
Foi atualizado:
23 abr 2017 ano
Indicadores de alterações dos valores ao longo dos anos
Mínimo:
92.908
1 jan 1974 ano
Máximo:
1.287 mil
1 jan 2015 ano
Na data de observação
Valor
Mudança absoluta
A alteração em relação ao valor anterior
1 jan 1971 ano
152.34
+152.34
0.0%
1 jan 1972 ano
164.465
+12.125
7.96%
1 jan 1973 ano
138.966
-25.499
-15.5%
1 jan 1974 ano
92.908
-46.059
-33.14%
1 jan 1975 ano
125.277
+32.369
34.84%
1 jan 1976 ano
152.598
+27.321
21.81%
1 jan 1977 ano
178.587
+25.989
17.03%
1 jan 1978 ano
200.099
+21.513
12.05%
1 jan 1979 ano
238.374
+38.275
19.13%
1 jan 1980 ano
255.387
+17.012
7.14%
1 jan 1981 ano
295.837
+40.45
15.84%
1 jan 1982 ano
340.743
+44.906
15.18%
1 jan 1983 ano
357.63
+16.886
4.96%
1 jan 1984 ano
333.818
-23.812
-6.66%
1 jan 1985 ano
346.144
+12.326
3.69%
1 jan 1986 ano
330.408
-15.735
-4.55%
1 jan 1987 ano
309.341
-21.067
-6.38%
1 jan 1988 ano
326.068
+16.727
5.41%
1 jan 1989 ano
358.885
+32.817
10.06%
1 jan 1990 ano
361.631
+2.746
0.77%
1 jan 1991 ano
347.548
-14.083
-3.89%
1 jan 1992 ano
376.897
+29.348
8.44%
1 jan 1993 ano
385.046
+8.15
2.16%
1 jan 1994 ano
397.385
+12.339
3.2%
1 jan 1995 ano
389.574
-7.811
-1.97%
1 jan 1996 ano
447.104
+57.53
14.77%
1 jan 1997 ano
446.662
-0.442
-0.1%
1 jan 1998 ano
427.556
-19.106
-4.28%
1 jan 1999 ano
415.791
-11.765
-2.75%
1 jan 2000 ano
411.994
-3.797
-0.91%
1 jan 2001 ano
462.394
+50.4
12.23%
1 jan 2002 ano
442.459
-19.935
-4.31%
1 jan 2003 ano
443.478
+1.019
0.23%
1 jan 2004 ano
508.237
+64.759
14.6%
1 jan 2005 ano
582.656
+74.419
14.64%
1 jan 2006 ano
621.142
+38.486
6.61%
1 jan 2007 ano
765.809
+144.667
23.29%
1 jan 2008 ano
834.217
+68.407
8.93%
1 jan 2009 ano
902.635
+68.418
8.2%
1 jan 2010 ano
927.49
+24.855
2.75%
1 jan 2011 ano
968.559
+41.069
4.43%
1 jan 2012 ano
1.165 mil
+195.956
20.23%
1 jan 2013 ano
1.214 mil
+49.682
4.27%
1 jan 2014 ano
1.229 mil
+15.161
1.25%
1 jan 2015 ano
1.287 mil
+57.341
4.66%
Classificação de países por estatísticas atuais por anos


Comentários: