29
/pt/
pt
AIzaSyAYiBZKx7MnpbEhh9jyipgxe19OcubqV5w
April 1, 2024
72337
Aruba
ABW
true
2
1
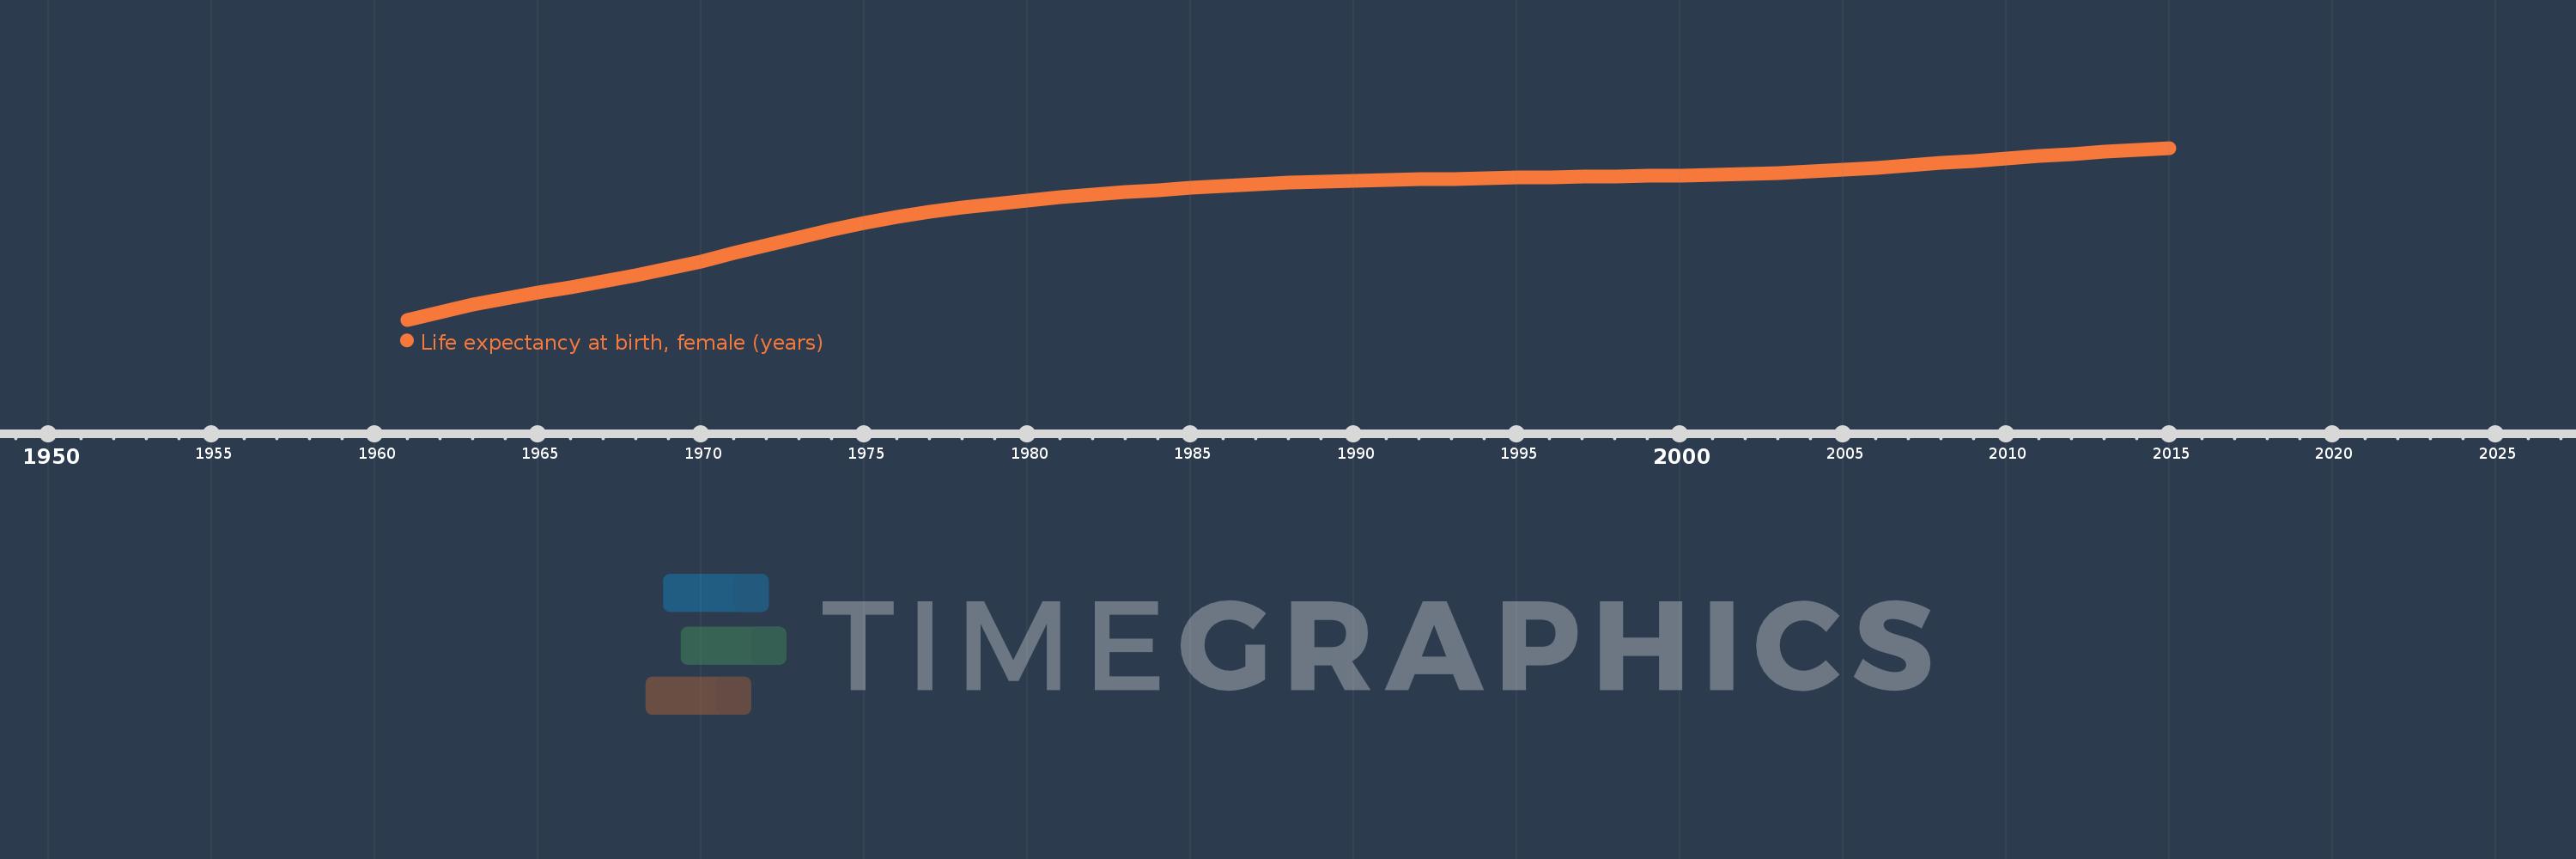
Life expectancy at birth, female (years)
2015,2014,2013,2012,2011,2010,2009,2008,2007,2006,2005,2004,2003,2002,2001,2000,1999,1998,1997,1996,1995,1994,1993,1992,1991,1990,1989,1988,1987,1986,1985,1984,1983,1982,1981,1980,1979,1978,1977,1976,1975,1974,1973,1972,1971,1970,1969,1968,1967,1966,1965,1964,1963,1962,1961
Estas estatísticas em outros países:
AfghanistanAlbaniaAlgeriaAngolaAntigua and BarbudaArab WorldArgentinaArmeniaArubaAustraliaAustriaAzerbaijanBahamas, TheBahrainBangladeshBarbadosBelarusBelgiumBelizeBeninBermudaBhutanBoliviaBosnia and HerzegovinaBotswanaBrazilBrunei DarussalamBulgariaBurkina FasoBurundiCabo VerdeCambodiaCameroonCanadaCaribbean small statesCentral African RepublicCentral Europe and the BalticsChadChannel IslandsChileChinaColombiaComorosCongo, Dem. Rep.Congo, Rep.Costa RicaCote d'IvoireCroatiaCubaCuracaoCyprusCzech RepublicDenmarkDjiboutiDominicaDominican RepublicEarly-demographic dividendEast Asia & PacificEast Asia & Pacific (excluding high income)East Asia & Pacific (IDA & IBRD countries)EcuadorEgypt, Arab Rep.El SalvadorEquatorial GuineaEritreaEstoniaEthiopiaEuro areaEurope & Central AsiaEurope & Central Asia (excluding high income)Europe & Central Asia (IDA & IBRD countries)European UnionFaroe IslandsFijiFinlandFragile and conflict affected situationsFranceFrench PolynesiaGabonGambia, TheGeorgiaGermanyGhanaGreeceGreenlandGrenadaGuamGuatemalaGuineaGuinea-BissauGuyanaHaitiHeavily indebted poor countries (HIPC)High incomeHondurasHong Kong SAR, ChinaHungaryIBRD onlyIcelandIDA & IBRD totalIDA blendIDA onlyIDA totalIndiaIndonesiaIran, Islamic Rep.IraqIrelandIsle of ManIsraelItalyJamaicaJapanJordanKazakhstanKenyaKiribatiKorea, Dem. People’s Rep.Korea, Rep.KosovoKuwaitKyrgyz RepublicLao PDRLate-demographic dividendLatin America & Caribbean Latin America & Caribbean (excluding high income)Latin America & the Caribbean (IDA & IBRD countries)LatviaLeast developed countries: UN classificationLebanonLesothoLiberiaLibyaLiechtensteinLithuaniaLow & middle incomeLow incomeLower middle incomeLuxembourgMacao SAR, ChinaMacedonia, FYRMadagascarMalawiMalaysiaMaldivesMaliMaltaMarshall IslandsMauritaniaMauritiusMexicoMicronesia, Fed. Sts.Middle East & North AfricaMiddle East & North Africa (excluding high income)Middle East & North Africa (IDA & IBRD countries)Middle incomeMoldovaMongoliaMontenegroMoroccoMozambiqueMyanmarNamibiaNepalNetherlandsNew CaledoniaNew ZealandNicaraguaNigerNigeriaNorth AmericaNorwayOECD membersOmanOther small statesPacific island small statesPakistanPalauPanamaPapua New GuineaParaguayPeruPhilippinesPolandPortugalPost-demographic dividendPre-demographic dividendPuerto RicoQatarRomaniaRussian FederationRwandaSamoaSan MarinoSao Tome and PrincipeSaudi ArabiaSenegalSerbiaSeychellesSierra LeoneSingaporeSint Maarten (Dutch part)Slovak RepublicSloveniaSmall statesSolomon IslandsSomaliaSouth AfricaSouth AsiaSouth Asia (IDA & IBRD)South SudanSpainSri LankaSt. Kitts and NevisSt. LuciaSt. Martin (French part)St. Vincent and the GrenadinesSub-Saharan Africa Sub-Saharan Africa (excluding high income)Sub-Saharan Africa (IDA & IBRD countries)SudanSurinameSwazilandSwedenSwitzerlandSyrian Arab RepublicTajikistanTanzaniaThailandTimor-LesteTogoTongaTrinidad and TobagoTunisiaTurkeyTurkmenistanUgandaUkraineUnited Arab EmiratesUnited KingdomUnited StatesUpper middle incomeUruguayUzbekistanVanuatuVenezuela, RBVietnamVirgin Islands (U.S.)West Bank and GazaWorldYemen, Rep.ZambiaZimbabwe Linha do tempo:
Nesta escala de tempo está apresentado um gráfico de 1961 ano até 2015 ano Aruba. Dados de 1960 ano ausente. O número de observações reais por data: 55.
Fonte (nome):
Indicadores de desenvolvimento mundial
Fonte (organização):
(1) United Nations Population Division. World Population Prospects, (2) Census reports and other statistical publications from national statistical offices, (3) Eurostat: Demographic Statistics, (4) United Nations Statistical Division. Population and Vital Statistics Reprot (various years), (5) U.S. Census Bureau: International Database, and (6) Secretariat of the Pacific Community: Statistics and Demography Programme.
Categorias:
Health, Gender, Social Development
Foi atualizado:
23 abr 2017 ano
Indicadores de alterações dos valores ao longo dos anos
Mínimo:
67.129
1 jan 1961 ano
Máximo:
77.946
1 jan 2015 ano
Na data de observação
Valor
Mudança absoluta
A alteração em relação ao valor anterior
1 jan 1961 ano
67.129
+67.129
0.0%
1 jan 1962 ano
67.625
+0.496
0.74%
1 jan 1963 ano
68.065
+0.44
0.65%
1 jan 1964 ano
68.458
+0.393
0.58%
1 jan 1965 ano
68.817
+0.359
0.52%
1 jan 1966 ano
69.165
+0.348
0.51%
1 jan 1967 ano
69.526
+0.361
0.52%
1 jan 1968 ano
69.917
+0.391
0.56%
1 jan 1969 ano
70.345
+0.428
0.61%
1 jan 1970 ano
70.811
+0.466
0.66%
1 jan 1971 ano
71.306
+0.495
0.7%
1 jan 1972 ano
71.815
+0.509
0.71%
1 jan 1973 ano
72.312
+0.497
0.69%
1 jan 1974 ano
72.779
+0.467
0.65%
1 jan 1975 ano
73.204
+0.425
0.58%
1 jan 1976 ano
73.579
+0.375
0.51%
1 jan 1977 ano
73.902
+0.323
0.44%
1 jan 1978 ano
74.183
+0.281
0.38%
1 jan 1979 ano
74.43
+0.247
0.33%
1 jan 1980 ano
74.647
+0.217
0.29%
1 jan 1981 ano
74.839
+0.192
0.26%
1 jan 1982 ano
75.01
+0.171
0.23%
1 jan 1983 ano
75.164
+0.154
0.21%
1 jan 1984 ano
75.305
+0.141
0.19%
1 jan 1985 ano
75.436
+0.131
0.17%
1 jan 1986 ano
75.556
+0.12
0.16%
1 jan 1987 ano
75.663
+0.107
0.14%
1 jan 1988 ano
75.754
+0.091
0.12%
1 jan 1989 ano
75.827
+0.073
0.1%
1 jan 1990 ano
75.886
+0.059
0.08%
1 jan 1991 ano
75.932
+0.046
0.06%
1 jan 1992 ano
75.969
+0.037
0.05%
1 jan 1993 ano
76.002
+0.033
0.04%
1 jan 1994 ano
76.033
+0.031
0.04%
1 jan 1995 ano
76.066
+0.033
0.04%
1 jan 1996 ano
76.1
+0.034
0.04%
1 jan 1997 ano
76.133
+0.033
0.04%
1 jan 1998 ano
76.164
+0.031
0.04%
1 jan 1999 ano
76.192
+0.028
0.04%
1 jan 2000 ano
76.221
+0.029
0.04%
1 jan 2001 ano
76.257
+0.036
0.05%
1 jan 2002 ano
76.307
+0.05
0.07%
1 jan 2003 ano
76.375
+0.068
0.09%
1 jan 2004 ano
76.465
+0.09
0.12%
1 jan 2005 ano
76.575
+0.11
0.14%
1 jan 2006 ano
76.703
+0.128
0.17%
1 jan 2007 ano
76.846
+0.143
0.19%
1 jan 2008 ano
76.994
+0.148
0.19%
1 jan 2009 ano
77.144
+0.15
0.19%
1 jan 2010 ano
77.29
+0.146
0.19%
1 jan 2011 ano
77.43
+0.14
0.18%
1 jan 2012 ano
77.564
+0.134
0.17%
1 jan 2013 ano
77.694
+0.13
0.17%
1 jan 2014 ano
77.821
+0.127
0.16%
1 jan 2015 ano
77.946
+0.125
0.16%
Classificação de países por estatísticas atuais por anos


Comentários: