29
/pt/
pt
AIzaSyAYiBZKx7MnpbEhh9jyipgxe19OcubqV5w
April 1, 2024
123730
Ecuador
ECU
true
2
1
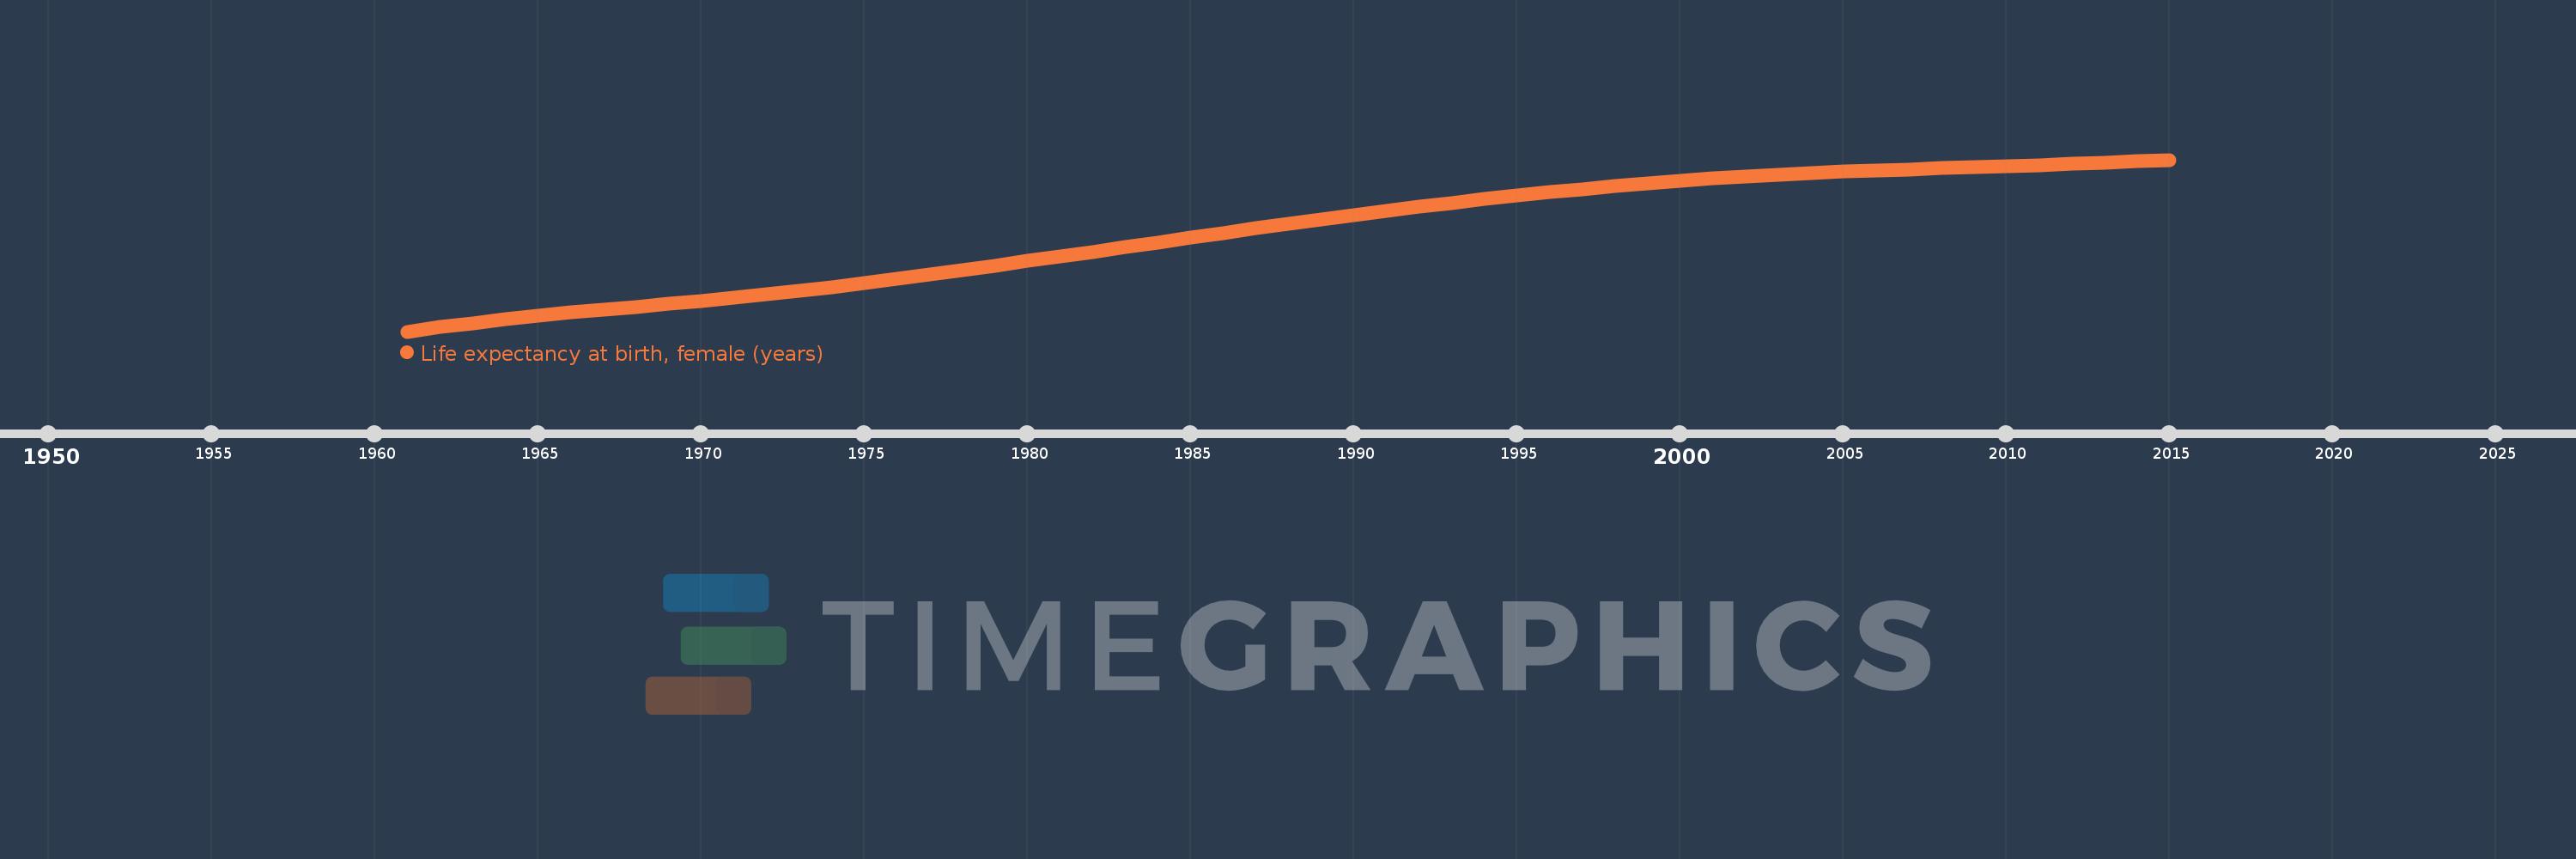
Life expectancy at birth, female (years)
2015,2014,2013,2012,2011,2010,2009,2008,2007,2006,2005,2004,2003,2002,2001,2000,1999,1998,1997,1996,1995,1994,1993,1992,1991,1990,1989,1988,1987,1986,1985,1984,1983,1982,1981,1980,1979,1978,1977,1976,1975,1974,1973,1972,1971,1970,1969,1968,1967,1966,1965,1964,1963,1962,1961
Estas estatísticas em outros países:
AfghanistanAlbaniaAlgeriaAngolaAntigua and BarbudaArab WorldArgentinaArmeniaArubaAustraliaAustriaAzerbaijanBahamas, TheBahrainBangladeshBarbadosBelarusBelgiumBelizeBeninBermudaBhutanBoliviaBosnia and HerzegovinaBotswanaBrazilBrunei DarussalamBulgariaBurkina FasoBurundiCabo VerdeCambodiaCameroonCanadaCaribbean small statesCentral African RepublicCentral Europe and the BalticsChadChannel IslandsChileChinaColombiaComorosCongo, Dem. Rep.Congo, Rep.Costa RicaCote d'IvoireCroatiaCubaCuracaoCyprusCzech RepublicDenmarkDjiboutiDominicaDominican RepublicEarly-demographic dividendEast Asia & PacificEast Asia & Pacific (excluding high income)East Asia & Pacific (IDA & IBRD countries)EcuadorEgypt, Arab Rep.El SalvadorEquatorial GuineaEritreaEstoniaEthiopiaEuro areaEurope & Central AsiaEurope & Central Asia (excluding high income)Europe & Central Asia (IDA & IBRD countries)European UnionFaroe IslandsFijiFinlandFragile and conflict affected situationsFranceFrench PolynesiaGabonGambia, TheGeorgiaGermanyGhanaGreeceGreenlandGrenadaGuamGuatemalaGuineaGuinea-BissauGuyanaHaitiHeavily indebted poor countries (HIPC)High incomeHondurasHong Kong SAR, ChinaHungaryIBRD onlyIcelandIDA & IBRD totalIDA blendIDA onlyIDA totalIndiaIndonesiaIran, Islamic Rep.IraqIrelandIsle of ManIsraelItalyJamaicaJapanJordanKazakhstanKenyaKiribatiKorea, Dem. People’s Rep.Korea, Rep.KosovoKuwaitKyrgyz RepublicLao PDRLate-demographic dividendLatin America & Caribbean Latin America & Caribbean (excluding high income)Latin America & the Caribbean (IDA & IBRD countries)LatviaLeast developed countries: UN classificationLebanonLesothoLiberiaLibyaLiechtensteinLithuaniaLow & middle incomeLow incomeLower middle incomeLuxembourgMacao SAR, ChinaMacedonia, FYRMadagascarMalawiMalaysiaMaldivesMaliMaltaMarshall IslandsMauritaniaMauritiusMexicoMicronesia, Fed. Sts.Middle East & North AfricaMiddle East & North Africa (excluding high income)Middle East & North Africa (IDA & IBRD countries)Middle incomeMoldovaMongoliaMontenegroMoroccoMozambiqueMyanmarNamibiaNepalNetherlandsNew CaledoniaNew ZealandNicaraguaNigerNigeriaNorth AmericaNorwayOECD membersOmanOther small statesPacific island small statesPakistanPalauPanamaPapua New GuineaParaguayPeruPhilippinesPolandPortugalPost-demographic dividendPre-demographic dividendPuerto RicoQatarRomaniaRussian FederationRwandaSamoaSan MarinoSao Tome and PrincipeSaudi ArabiaSenegalSerbiaSeychellesSierra LeoneSingaporeSint Maarten (Dutch part)Slovak RepublicSloveniaSmall statesSolomon IslandsSomaliaSouth AfricaSouth AsiaSouth Asia (IDA & IBRD)South SudanSpainSri LankaSt. Kitts and NevisSt. LuciaSt. Martin (French part)St. Vincent and the GrenadinesSub-Saharan Africa Sub-Saharan Africa (excluding high income)Sub-Saharan Africa (IDA & IBRD countries)SudanSurinameSwazilandSwedenSwitzerlandSyrian Arab RepublicTajikistanTanzaniaThailandTimor-LesteTogoTongaTrinidad and TobagoTunisiaTurkeyTurkmenistanUgandaUkraineUnited Arab EmiratesUnited KingdomUnited StatesUpper middle incomeUruguayUzbekistanVanuatuVenezuela, RBVietnamVirgin Islands (U.S.)West Bank and GazaWorldYemen, Rep.ZambiaZimbabwe Linha do tempo:
Nesta escala de tempo está apresentado um gráfico de 1961 ano até 2015 ano Ecuador. Dados de 1960 ano ausente. O número de observações reais por data: 55.
Fonte (nome):
Indicadores de desenvolvimento mundial
Fonte (organização):
(1) United Nations Population Division. World Population Prospects, (2) Census reports and other statistical publications from national statistical offices, (3) Eurostat: Demographic Statistics, (4) United Nations Statistical Division. Population and Vital Statistics Reprot (various years), (5) U.S. Census Bureau: International Database, and (6) Secretariat of the Pacific Community: Statistics and Demography Programme.
Categorias:
Health, Gender, Social Development
Foi atualizado:
23 abr 2017 ano
Indicadores de alterações dos valores ao longo dos anos
Mínimo:
54.538
1 jan 1961 ano
Máximo:
78.687
1 jan 2015 ano
Na data de observação
Valor
Mudança absoluta
A alteração em relação ao valor anterior
1 jan 1961 ano
54.538
+54.538
0.0%
1 jan 1962 ano
55.152
+0.614
1.13%
1 jan 1963 ano
55.73
+0.578
1.05%
1 jan 1964 ano
56.267
+0.537
0.96%
1 jan 1965 ano
56.761
+0.494
0.88%
1 jan 1966 ano
57.214
+0.453
0.8%
1 jan 1967 ano
57.633
+0.419
0.73%
1 jan 1968 ano
58.035
+0.402
0.7%
1 jan 1969 ano
58.434
+0.399
0.69%
1 jan 1970 ano
58.844
+0.41
0.7%
1 jan 1971 ano
59.277
+0.433
0.74%
1 jan 1972 ano
59.742
+0.465
0.78%
1 jan 1973 ano
60.242
+0.5
0.84%
1 jan 1974 ano
60.776
+0.534
0.89%
1 jan 1975 ano
61.344
+0.568
0.93%
1 jan 1976 ano
61.941
+0.597
0.97%
1 jan 1977 ano
62.56
+0.619
1.0%
1 jan 1978 ano
63.192
+0.632
1.01%
1 jan 1979 ano
63.828
+0.636
1.01%
1 jan 1980 ano
64.464
+0.636
1.0%
1 jan 1981 ano
65.1
+0.636
0.99%
1 jan 1982 ano
65.74
+0.64
0.98%
1 jan 1983 ano
66.388
+0.648
0.99%
1 jan 1984 ano
67.046
+0.658
0.99%
1 jan 1985 ano
67.709
+0.663
0.99%
1 jan 1986 ano
68.373
+0.664
0.98%
1 jan 1987 ano
69.034
+0.661
0.97%
1 jan 1988 ano
69.684
+0.65
0.94%
1 jan 1989 ano
70.319
+0.635
0.91%
1 jan 1990 ano
70.932
+0.613
0.87%
1 jan 1991 ano
71.521
+0.589
0.83%
1 jan 1992 ano
72.086
+0.565
0.79%
1 jan 1993 ano
72.627
+0.541
0.75%
1 jan 1994 ano
73.146
+0.519
0.71%
1 jan 1995 ano
73.641
+0.495
0.68%
1 jan 1996 ano
74.111
+0.47
0.64%
1 jan 1997 ano
74.556
+0.445
0.6%
1 jan 1998 ano
74.975
+0.419
0.56%
1 jan 1999 ano
75.368
+0.393
0.52%
1 jan 2000 ano
75.733
+0.365
0.48%
1 jan 2001 ano
76.066
+0.333
0.44%
1 jan 2002 ano
76.362
+0.296
0.39%
1 jan 2003 ano
76.621
+0.259
0.34%
1 jan 2004 ano
76.844
+0.223
0.29%
1 jan 2005 ano
77.037
+0.193
0.25%
1 jan 2006 ano
77.205
+0.168
0.22%
1 jan 2007 ano
77.356
+0.151
0.2%
1 jan 2008 ano
77.497
+0.141
0.18%
1 jan 2009 ano
77.636
+0.139
0.18%
1 jan 2010 ano
77.78
+0.144
0.19%
1 jan 2011 ano
77.936
+0.156
0.2%
1 jan 2012 ano
78.106
+0.17
0.22%
1 jan 2013 ano
78.289
+0.183
0.23%
1 jan 2014 ano
78.483
+0.194
0.25%
1 jan 2015 ano
78.687
+0.204
0.26%
Classificação de países por estatísticas atuais por anos


Comentários: