29
/pt/
pt
AIzaSyAYiBZKx7MnpbEhh9jyipgxe19OcubqV5w
April 1, 2024
117096
Cyprus
CYP
true
2
1
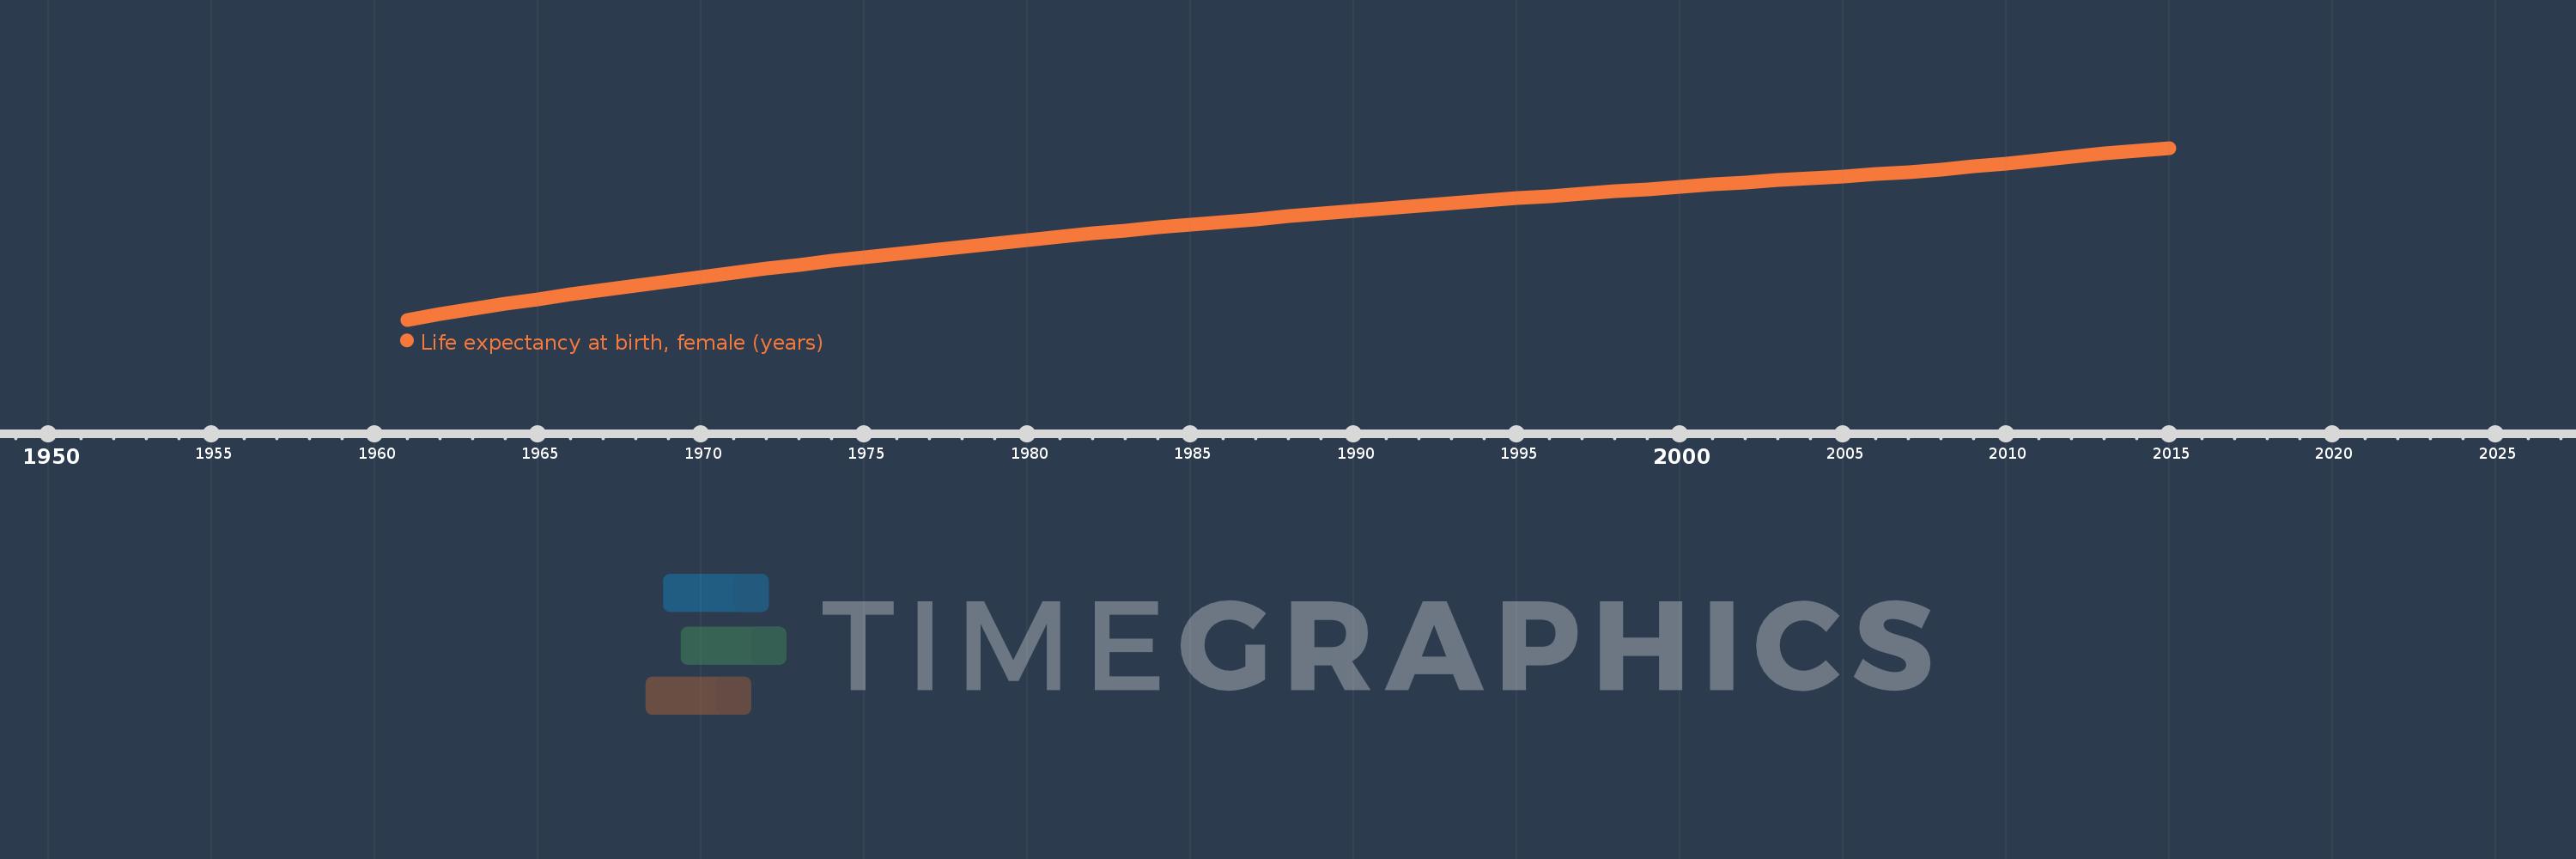
Life expectancy at birth, female (years)
2015,2014,2013,2012,2011,2010,2009,2008,2007,2006,2005,2004,2003,2002,2001,2000,1999,1998,1997,1996,1995,1994,1993,1992,1991,1990,1989,1988,1987,1986,1985,1984,1983,1982,1981,1980,1979,1978,1977,1976,1975,1974,1973,1972,1971,1970,1969,1968,1967,1966,1965,1964,1963,1962,1961
Estas estatísticas em outros países:
AfghanistanAlbaniaAlgeriaAngolaAntigua and BarbudaArab WorldArgentinaArmeniaArubaAustraliaAustriaAzerbaijanBahamas, TheBahrainBangladeshBarbadosBelarusBelgiumBelizeBeninBermudaBhutanBoliviaBosnia and HerzegovinaBotswanaBrazilBrunei DarussalamBulgariaBurkina FasoBurundiCabo VerdeCambodiaCameroonCanadaCaribbean small statesCentral African RepublicCentral Europe and the BalticsChadChannel IslandsChileChinaColombiaComorosCongo, Dem. Rep.Congo, Rep.Costa RicaCote d'IvoireCroatiaCubaCuracaoCyprusCzech RepublicDenmarkDjiboutiDominicaDominican RepublicEarly-demographic dividendEast Asia & PacificEast Asia & Pacific (excluding high income)East Asia & Pacific (IDA & IBRD countries)EcuadorEgypt, Arab Rep.El SalvadorEquatorial GuineaEritreaEstoniaEthiopiaEuro areaEurope & Central AsiaEurope & Central Asia (excluding high income)Europe & Central Asia (IDA & IBRD countries)European UnionFaroe IslandsFijiFinlandFragile and conflict affected situationsFranceFrench PolynesiaGabonGambia, TheGeorgiaGermanyGhanaGreeceGreenlandGrenadaGuamGuatemalaGuineaGuinea-BissauGuyanaHaitiHeavily indebted poor countries (HIPC)High incomeHondurasHong Kong SAR, ChinaHungaryIBRD onlyIcelandIDA & IBRD totalIDA blendIDA onlyIDA totalIndiaIndonesiaIran, Islamic Rep.IraqIrelandIsle of ManIsraelItalyJamaicaJapanJordanKazakhstanKenyaKiribatiKorea, Dem. People’s Rep.Korea, Rep.KosovoKuwaitKyrgyz RepublicLao PDRLate-demographic dividendLatin America & Caribbean Latin America & Caribbean (excluding high income)Latin America & the Caribbean (IDA & IBRD countries)LatviaLeast developed countries: UN classificationLebanonLesothoLiberiaLibyaLiechtensteinLithuaniaLow & middle incomeLow incomeLower middle incomeLuxembourgMacao SAR, ChinaMacedonia, FYRMadagascarMalawiMalaysiaMaldivesMaliMaltaMarshall IslandsMauritaniaMauritiusMexicoMicronesia, Fed. Sts.Middle East & North AfricaMiddle East & North Africa (excluding high income)Middle East & North Africa (IDA & IBRD countries)Middle incomeMoldovaMongoliaMontenegroMoroccoMozambiqueMyanmarNamibiaNepalNetherlandsNew CaledoniaNew ZealandNicaraguaNigerNigeriaNorth AmericaNorwayOECD membersOmanOther small statesPacific island small statesPakistanPalauPanamaPapua New GuineaParaguayPeruPhilippinesPolandPortugalPost-demographic dividendPre-demographic dividendPuerto RicoQatarRomaniaRussian FederationRwandaSamoaSan MarinoSao Tome and PrincipeSaudi ArabiaSenegalSerbiaSeychellesSierra LeoneSingaporeSint Maarten (Dutch part)Slovak RepublicSloveniaSmall statesSolomon IslandsSomaliaSouth AfricaSouth AsiaSouth Asia (IDA & IBRD)South SudanSpainSri LankaSt. Kitts and NevisSt. LuciaSt. Martin (French part)St. Vincent and the GrenadinesSub-Saharan Africa Sub-Saharan Africa (excluding high income)Sub-Saharan Africa (IDA & IBRD countries)SudanSurinameSwazilandSwedenSwitzerlandSyrian Arab RepublicTajikistanTanzaniaThailandTimor-LesteTogoTongaTrinidad and TobagoTunisiaTurkeyTurkmenistanUgandaUkraineUnited Arab EmiratesUnited KingdomUnited StatesUpper middle incomeUruguayUzbekistanVanuatuVenezuela, RBVietnamVirgin Islands (U.S.)West Bank and GazaWorldYemen, Rep.ZambiaZimbabwe Linha do tempo:
Nesta escala de tempo está apresentado um gráfico de 1961 ano até 2015 ano Cyprus. Dados de 1960 ano ausente. O número de observações reais por data: 55.
Fonte (nome):
Indicadores de desenvolvimento mundial
Fonte (organização):
(1) United Nations Population Division. World Population Prospects, (2) Census reports and other statistical publications from national statistical offices, (3) Eurostat: Demographic Statistics, (4) United Nations Statistical Division. Population and Vital Statistics Reprot (various years), (5) U.S. Census Bureau: International Database, and (6) Secretariat of the Pacific Community: Statistics and Demography Programme.
Categorias:
Health, Gender, Social Development
Foi atualizado:
23 abr 2017 ano
Indicadores de alterações dos valores ao longo dos anos
Mínimo:
71.655
1 jan 1961 ano
Máximo:
82.397
1 jan 2015 ano
Na data de observação
Valor
Mudança absoluta
A alteração em relação ao valor anterior
1 jan 1961 ano
71.655
+71.655
0.0%
1 jan 1962 ano
71.993
+0.338
0.47%
1 jan 1963 ano
72.32
+0.327
0.45%
1 jan 1964 ano
72.636
+0.316
0.44%
1 jan 1965 ano
72.943
+0.307
0.42%
1 jan 1966 ano
73.241
+0.298
0.41%
1 jan 1967 ano
73.53
+0.289
0.39%
1 jan 1968 ano
73.81
+0.28
0.38%
1 jan 1969 ano
74.082
+0.272
0.37%
1 jan 1970 ano
74.346
+0.264
0.36%
1 jan 1971 ano
74.603
+0.257
0.35%
1 jan 1972 ano
74.853
+0.25
0.34%
1 jan 1973 ano
75.097
+0.244
0.33%
1 jan 1974 ano
75.335
+0.238
0.32%
1 jan 1975 ano
75.566
+0.231
0.31%
1 jan 1976 ano
75.792
+0.226
0.3%
1 jan 1977 ano
76.013
+0.221
0.29%
1 jan 1978 ano
76.229
+0.216
0.28%
1 jan 1979 ano
76.439
+0.21
0.28%
1 jan 1980 ano
76.644
+0.205
0.27%
1 jan 1981 ano
76.844
+0.2
0.26%
1 jan 1982 ano
77.039
+0.195
0.25%
1 jan 1983 ano
77.23
+0.191
0.25%
1 jan 1984 ano
77.415
+0.185
0.24%
1 jan 1985 ano
77.597
+0.182
0.24%
1 jan 1986 ano
77.774
+0.177
0.23%
1 jan 1987 ano
77.949
+0.175
0.23%
1 jan 1988 ano
78.12
+0.171
0.22%
1 jan 1989 ano
78.288
+0.168
0.22%
1 jan 1990 ano
78.453
+0.165
0.21%
1 jan 1991 ano
78.616
+0.163
0.21%
1 jan 1992 ano
78.776
+0.16
0.2%
1 jan 1993 ano
78.934
+0.158
0.2%
1 jan 1994 ano
79.088
+0.154
0.2%
1 jan 1995 ano
79.24
+0.152
0.19%
1 jan 1996 ano
79.389
+0.149
0.19%
1 jan 1997 ano
79.536
+0.147
0.19%
1 jan 1998 ano
79.681
+0.145
0.18%
1 jan 1999 ano
79.825
+0.144
0.18%
1 jan 2000 ano
79.967
+0.142
0.18%
1 jan 2001 ano
80.106
+0.139
0.17%
1 jan 2002 ano
80.24
+0.134
0.17%
1 jan 2003 ano
80.368
+0.128
0.16%
1 jan 2004 ano
80.494
+0.126
0.16%
1 jan 2005 ano
80.618
+0.124
0.15%
1 jan 2006 ano
80.748
+0.13
0.16%
1 jan 2007 ano
80.891
+0.143
0.18%
1 jan 2008 ano
81.052
+0.161
0.2%
1 jan 2009 ano
81.231
+0.179
0.22%
1 jan 2010 ano
81.426
+0.195
0.24%
1 jan 2011 ano
81.631
+0.205
0.25%
1 jan 2012 ano
81.839
+0.208
0.25%
1 jan 2013 ano
82.04
+0.201
0.25%
1 jan 2014 ano
82.227
+0.187
0.23%
1 jan 2015 ano
82.397
+0.17
0.21%
Classificação de países por estatísticas atuais por anos


Comentários: