29
/pt/
pt
AIzaSyAYiBZKx7MnpbEhh9jyipgxe19OcubqV5w
April 1, 2024
63688
Afghanistan
AFG
true
2
1
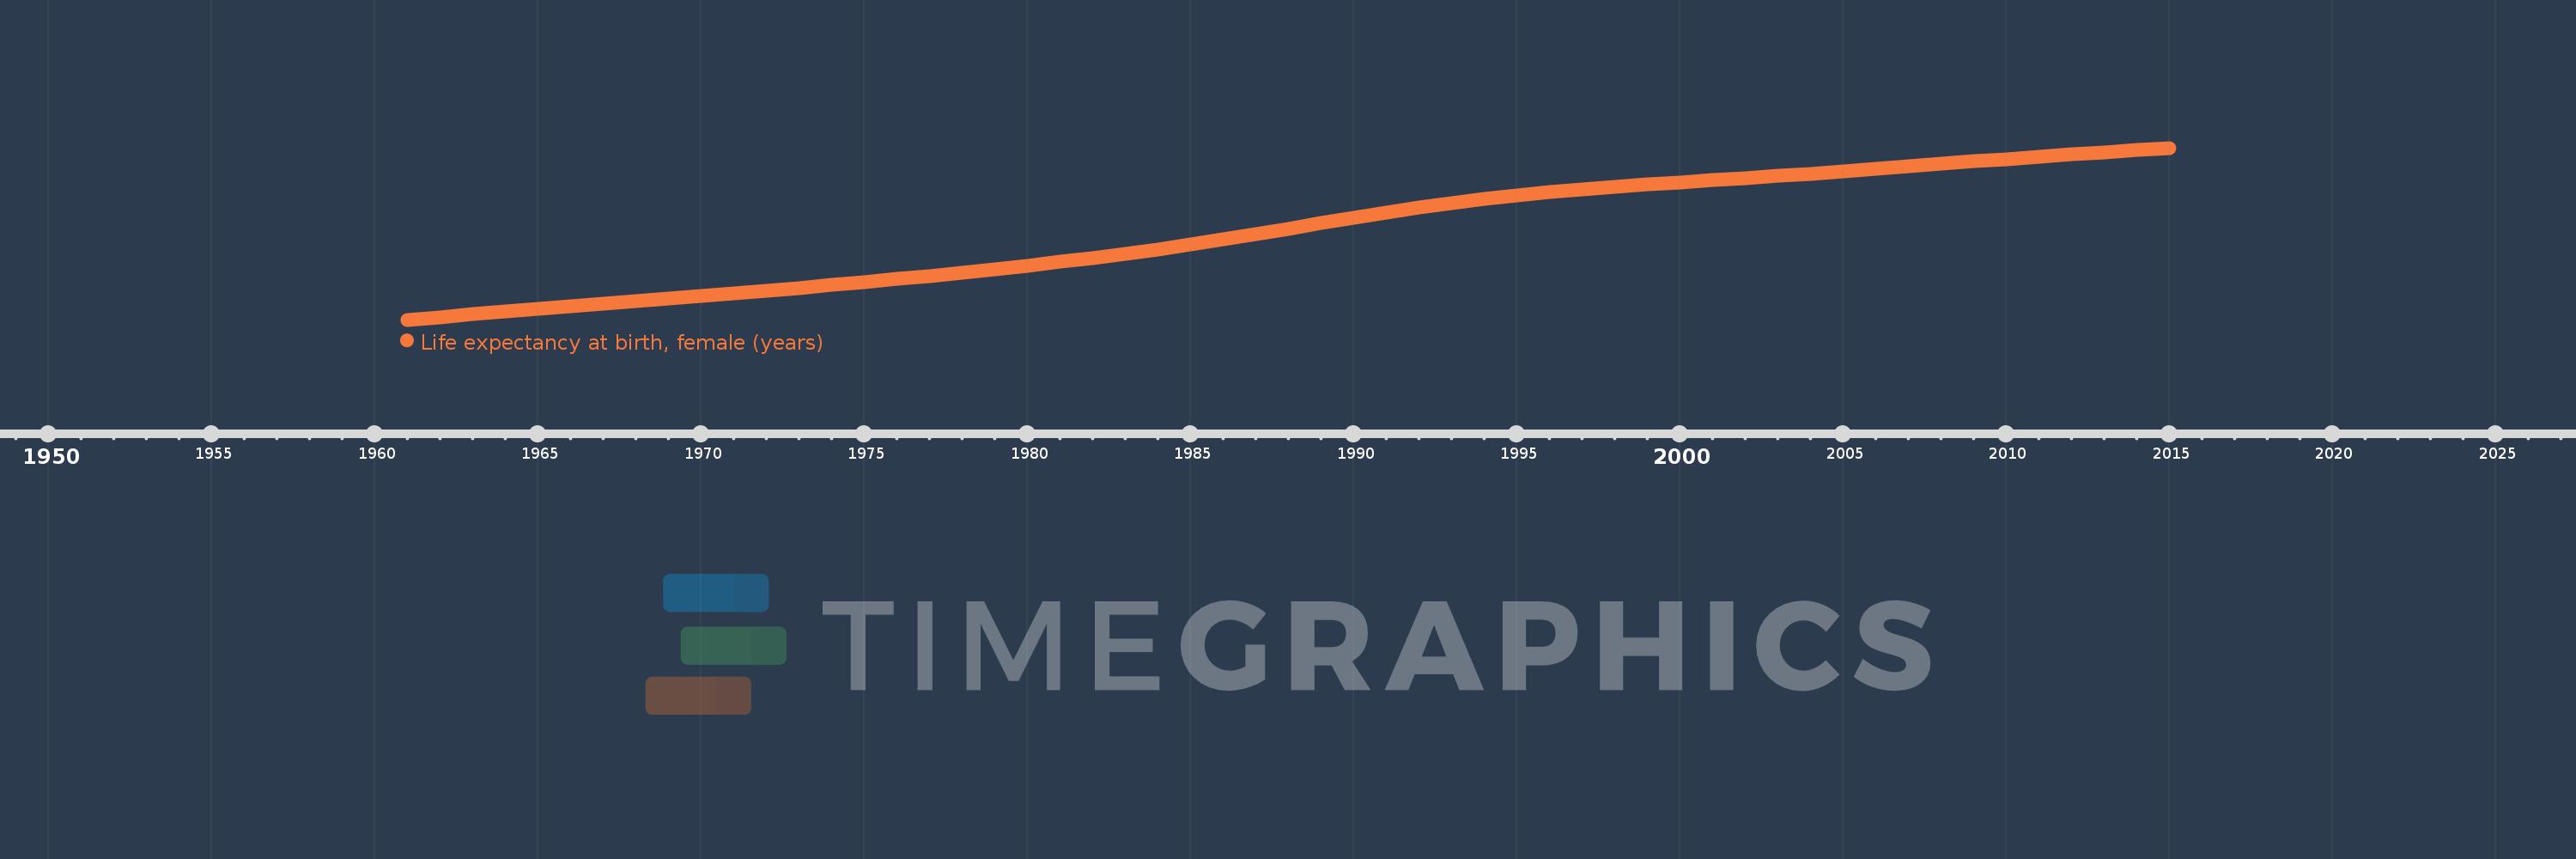
Life expectancy at birth, female (years)
2015,2014,2013,2012,2011,2010,2009,2008,2007,2006,2005,2004,2003,2002,2001,2000,1999,1998,1997,1996,1995,1994,1993,1992,1991,1990,1989,1988,1987,1986,1985,1984,1983,1982,1981,1980,1979,1978,1977,1976,1975,1974,1973,1972,1971,1970,1969,1968,1967,1966,1965,1964,1963,1962,1961
Estas estatísticas em outros países:
AfghanistanAlbaniaAlgeriaAngolaAntigua and BarbudaArab WorldArgentinaArmeniaArubaAustraliaAustriaAzerbaijanBahamas, TheBahrainBangladeshBarbadosBelarusBelgiumBelizeBeninBermudaBhutanBoliviaBosnia and HerzegovinaBotswanaBrazilBrunei DarussalamBulgariaBurkina FasoBurundiCabo VerdeCambodiaCameroonCanadaCaribbean small statesCentral African RepublicCentral Europe and the BalticsChadChannel IslandsChileChinaColombiaComorosCongo, Dem. Rep.Congo, Rep.Costa RicaCote d'IvoireCroatiaCubaCuracaoCyprusCzech RepublicDenmarkDjiboutiDominicaDominican RepublicEarly-demographic dividendEast Asia & PacificEast Asia & Pacific (excluding high income)East Asia & Pacific (IDA & IBRD countries)EcuadorEgypt, Arab Rep.El SalvadorEquatorial GuineaEritreaEstoniaEthiopiaEuro areaEurope & Central AsiaEurope & Central Asia (excluding high income)Europe & Central Asia (IDA & IBRD countries)European UnionFaroe IslandsFijiFinlandFragile and conflict affected situationsFranceFrench PolynesiaGabonGambia, TheGeorgiaGermanyGhanaGreeceGreenlandGrenadaGuamGuatemalaGuineaGuinea-BissauGuyanaHaitiHeavily indebted poor countries (HIPC)High incomeHondurasHong Kong SAR, ChinaHungaryIBRD onlyIcelandIDA & IBRD totalIDA blendIDA onlyIDA totalIndiaIndonesiaIran, Islamic Rep.IraqIrelandIsle of ManIsraelItalyJamaicaJapanJordanKazakhstanKenyaKiribatiKorea, Dem. People’s Rep.Korea, Rep.KosovoKuwaitKyrgyz RepublicLao PDRLate-demographic dividendLatin America & Caribbean Latin America & Caribbean (excluding high income)Latin America & the Caribbean (IDA & IBRD countries)LatviaLeast developed countries: UN classificationLebanonLesothoLiberiaLibyaLiechtensteinLithuaniaLow & middle incomeLow incomeLower middle incomeLuxembourgMacao SAR, ChinaMacedonia, FYRMadagascarMalawiMalaysiaMaldivesMaliMaltaMarshall IslandsMauritaniaMauritiusMexicoMicronesia, Fed. Sts.Middle East & North AfricaMiddle East & North Africa (excluding high income)Middle East & North Africa (IDA & IBRD countries)Middle incomeMoldovaMongoliaMontenegroMoroccoMozambiqueMyanmarNamibiaNepalNetherlandsNew CaledoniaNew ZealandNicaraguaNigerNigeriaNorth AmericaNorwayOECD membersOmanOther small statesPacific island small statesPakistanPalauPanamaPapua New GuineaParaguayPeruPhilippinesPolandPortugalPost-demographic dividendPre-demographic dividendPuerto RicoQatarRomaniaRussian FederationRwandaSamoaSan MarinoSao Tome and PrincipeSaudi ArabiaSenegalSerbiaSeychellesSierra LeoneSingaporeSint Maarten (Dutch part)Slovak RepublicSloveniaSmall statesSolomon IslandsSomaliaSouth AfricaSouth AsiaSouth Asia (IDA & IBRD)South SudanSpainSri LankaSt. Kitts and NevisSt. LuciaSt. Martin (French part)St. Vincent and the GrenadinesSub-Saharan Africa Sub-Saharan Africa (excluding high income)Sub-Saharan Africa (IDA & IBRD countries)SudanSurinameSwazilandSwedenSwitzerlandSyrian Arab RepublicTajikistanTanzaniaThailandTimor-LesteTogoTongaTrinidad and TobagoTunisiaTurkeyTurkmenistanUgandaUkraineUnited Arab EmiratesUnited KingdomUnited StatesUpper middle incomeUruguayUzbekistanVanuatuVenezuela, RBVietnamVirgin Islands (U.S.)West Bank and GazaWorldYemen, Rep.ZambiaZimbabwe Linha do tempo:
Nesta escala de tempo está apresentado um gráfico de 1961 ano até 2015 ano Afghanistan. Dados de 1960 ano ausente. O número de observações reais por data: 55.
Fonte (nome):
Indicadores de desenvolvimento mundial
Fonte (organização):
(1) United Nations Population Division. World Population Prospects, (2) Census reports and other statistical publications from national statistical offices, (3) Eurostat: Demographic Statistics, (4) United Nations Statistical Division. Population and Vital Statistics Reprot (various years), (5) U.S. Census Bureau: International Database, and (6) Secretariat of the Pacific Community: Statistics and Demography Programme.
Categorias:
Health, Gender, Social Development
Foi atualizado:
23 abr 2017 ano
Indicadores de alterações dos valores ao longo dos anos
Mínimo:
33.105
1 jan 1961 ano
Máximo:
61.615
1 jan 2015 ano
Na data de observação
Valor
Mudança absoluta
A alteração em relação ao valor anterior
1 jan 1961 ano
33.105
+33.105
0.0%
1 jan 1962 ano
33.557
+0.452
1.37%
1 jan 1963 ano
34.001
+0.444
1.32%
1 jan 1964 ano
34.44
+0.439
1.29%
1 jan 1965 ano
34.875
+0.435
1.26%
1 jan 1966 ano
35.307
+0.432
1.24%
1 jan 1967 ano
35.738
+0.431
1.22%
1 jan 1968 ano
36.17
+0.432
1.21%
1 jan 1969 ano
36.603
+0.433
1.2%
1 jan 1970 ano
37.042
+0.439
1.2%
1 jan 1971 ano
37.487
+0.445
1.2%
1 jan 1972 ano
37.94
+0.453
1.21%
1 jan 1973 ano
38.402
+0.462
1.22%
1 jan 1974 ano
38.875
+0.473
1.23%
1 jan 1975 ano
39.363
+0.488
1.26%
1 jan 1976 ano
39.866
+0.503
1.28%
1 jan 1977 ano
40.386
+0.52
1.3%
1 jan 1978 ano
40.923
+0.537
1.33%
1 jan 1979 ano
41.482
+0.559
1.37%
1 jan 1980 ano
42.066
+0.584
1.41%
1 jan 1981 ano
42.685
+0.619
1.47%
1 jan 1982 ano
43.349
+0.664
1.56%
1 jan 1983 ano
44.061
+0.712
1.64%
1 jan 1984 ano
44.819
+0.758
1.72%
1 jan 1985 ano
45.619
+0.8
1.78%
1 jan 1986 ano
46.458
+0.839
1.84%
1 jan 1987 ano
47.332
+0.874
1.88%
1 jan 1988 ano
48.227
+0.895
1.89%
1 jan 1989 ano
49.126
+0.899
1.86%
1 jan 1990 ano
50.013
+0.887
1.81%
1 jan 1991 ano
50.867
+0.854
1.71%
1 jan 1992 ano
51.671
+0.804
1.58%
1 jan 1993 ano
52.416
+0.745
1.44%
1 jan 1994 ano
53.098
+0.682
1.3%
1 jan 1995 ano
53.713
+0.615
1.16%
1 jan 1996 ano
54.257
+0.544
1.01%
1 jan 1997 ano
54.734
+0.477
0.88%
1 jan 1998 ano
55.159
+0.425
0.78%
1 jan 1999 ano
55.548
+0.389
0.71%
1 jan 2000 ano
55.911
+0.363
0.65%
1 jan 2001 ano
56.265
+0.354
0.63%
1 jan 2002 ano
56.62
+0.355
0.63%
1 jan 2003 ano
56.983
+0.363
0.64%
1 jan 2004 ano
57.357
+0.374
0.66%
1 jan 2005 ano
57.747
+0.39
0.68%
1 jan 2006 ano
58.151
+0.404
0.7%
1 jan 2007 ano
58.564
+0.413
0.71%
1 jan 2008 ano
58.975
+0.411
0.7%
1 jan 2009 ano
59.379
+0.404
0.69%
1 jan 2010 ano
59.772
+0.393
0.66%
1 jan 2011 ano
60.154
+0.382
0.64%
1 jan 2012 ano
60.527
+0.373
0.62%
1 jan 2013 ano
60.893
+0.366
0.6%
1 jan 2014 ano
61.256
+0.363
0.6%
1 jan 2015 ano
61.615
+0.359
0.59%
Classificação de países por estatísticas atuais por anos


Comentários: