29
/pt/
pt
AIzaSyAYiBZKx7MnpbEhh9jyipgxe19OcubqV5w
April 1, 2024
70615
Argentina
ARG
true
2
1
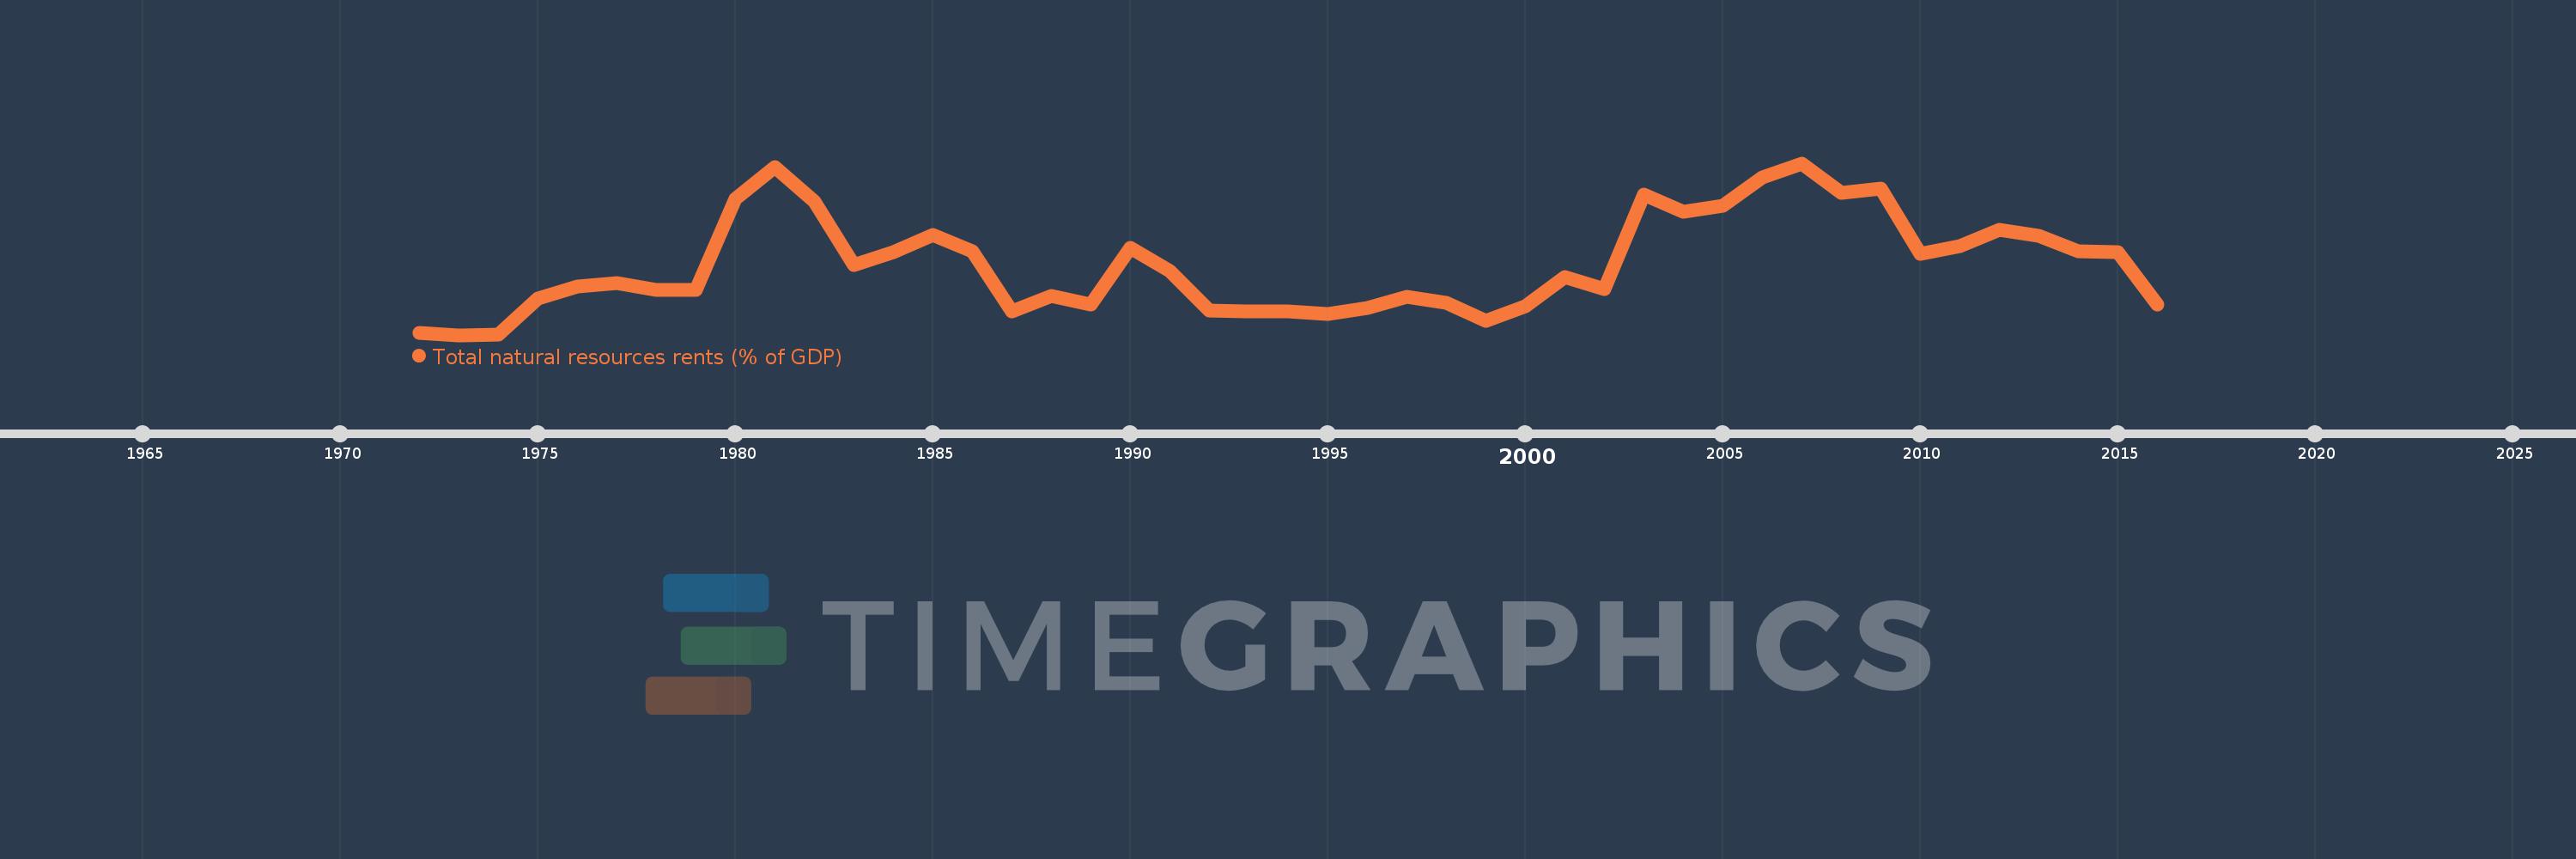
Total natural resources rents (% of GDP)
2016,2015,2014,2013,2012,2011,2010,2009,2008,2007,2006,2005,2004,2003,2002,2001,2000,1999,1998,1997,1996,1995,1994,1993,1992,1991,1990,1989,1988,1987,1986,1985,1984,1983,1982,1981,1980,1979,1978,1977,1976,1975,1974,1973,1972
Estas estatísticas em outros países:
AfghanistanAlbaniaAlgeriaAngolaArab WorldArgentinaArmeniaArubaAustraliaAustriaAzerbaijanBahamas, TheBahrainBangladeshBarbadosBelarusBelgiumBelizeBeninBhutanBoliviaBosnia and HerzegovinaBotswanaBrazilBrunei DarussalamBulgariaBurkina FasoBurundiCabo VerdeCambodiaCameroonCanadaCaribbean small statesCentral African RepublicCentral Europe and the BalticsChadChileChinaColombiaComorosCongo, Dem. Rep.Congo, Rep.Costa RicaCote d'IvoireCroatiaCubaCyprusCzech RepublicDenmarkDjiboutiDominicaDominican RepublicEarly-demographic dividendEast Asia & PacificEast Asia & Pacific (excluding high income)East Asia & Pacific (IDA & IBRD countries)EcuadorEgypt, Arab Rep.El SalvadorEquatorial GuineaEritreaEstoniaEthiopiaEuro areaEurope & Central AsiaEurope & Central Asia (excluding high income)Europe & Central Asia (IDA & IBRD countries)European UnionFijiFinlandFragile and conflict affected situationsFranceFrench PolynesiaGabonGambia, TheGeorgiaGermanyGhanaGreeceGuatemalaGuineaGuinea-BissauGuyanaHaitiHeavily indebted poor countries (HIPC)High incomeHondurasHong Kong SAR, ChinaHungaryIBRD onlyIcelandIDA & IBRD totalIDA blendIDA onlyIDA totalIndiaIndonesiaIran, Islamic Rep.IraqIrelandIsraelItalyJamaicaJapanJordanKazakhstanKenyaKiribatiKorea, Rep.KuwaitKyrgyz RepublicLao PDRLate-demographic dividendLatin America & Caribbean Latin America & Caribbean (excluding high income)Latin America & the Caribbean (IDA & IBRD countries)LatviaLeast developed countries: UN classificationLebanonLesothoLiberiaLibyaLithuaniaLow & middle incomeLow incomeLower middle incomeLuxembourgMacao SAR, ChinaMacedonia, FYRMadagascarMalawiMalaysiaMaldivesMaliMaltaMauritaniaMauritiusMexicoMiddle East & North AfricaMiddle East & North Africa (excluding high income)Middle East & North Africa (IDA & IBRD countries)Middle incomeMoldovaMongoliaMontenegroMoroccoMozambiqueMyanmarNamibiaNepalNetherlandsNew CaledoniaNew ZealandNicaraguaNigerNigeriaNorth AmericaNorwayOECD membersOmanOther small statesPacific island small statesPakistanPanamaPapua New GuineaParaguayPeruPhilippinesPolandPortugalPost-demographic dividendPre-demographic dividendQatarRomaniaRussian FederationRwandaSamoaSao Tome and PrincipeSaudi ArabiaSenegalSerbiaSeychellesSierra LeoneSingaporeSlovak RepublicSloveniaSmall statesSolomon IslandsSouth AfricaSouth AsiaSouth Asia (IDA & IBRD)South SudanSpainSri LankaSt. LuciaSt. Vincent and the GrenadinesSub-Saharan Africa Sub-Saharan Africa (excluding high income)Sub-Saharan Africa (IDA & IBRD countries)SudanSurinameSwazilandSwedenSwitzerlandSyrian Arab RepublicTajikistanTanzaniaThailandTimor-LesteTogoTongaTrinidad and TobagoTunisiaTurkeyTurkmenistanUgandaUkraineUnited Arab EmiratesUnited KingdomUnited StatesUpper middle incomeUruguayUzbekistanVanuatuVenezuela, RBVietnamWorldYemen, Rep.ZambiaZimbabwe Linha do tempo:
Nesta escala de tempo está apresentado um gráfico de 1972 ano até 2016 ano Argentina. Dados de 1971 ano ausente. O número de observações reais por data: 45.
Fonte (nome):
Indicadores de desenvolvimento mundial
Fonte (organização):
Estimates based on sources and methods described in "The Changing Wealth of Nations: Measuring Sustainable Development in the New Millennium" (World Bank, 2011).
Categorias:
Energy & Mining, Environment
Foi atualizado:
23 abr 2017 ano
Indicadores de alterações dos valores ao longo dos anos
Mínimo:
0.169
1 jan 1973 ano
Máximo:
5.886
1 jan 2007 ano
Na data de observação
Valor
Mudança absoluta
A alteração em relação ao valor anterior
1 jan 1972 ano
0.229
+0.229
0.0%
1 jan 1973 ano
0.169
-0.061
-26.5%
1 jan 1974 ano
0.179
+0.011
6.4%
1 jan 1975 ano
1.371
+1.192
664.65%
1 jan 1976 ano
1.777
+0.405
29.55%
1 jan 1977 ano
1.912
+0.135
7.61%
1 jan 1978 ano
1.672
-0.24
-12.54%
1 jan 1979 ano
1.683
+0.011
0.65%
1 jan 1980 ano
4.701
+3.018
179.36%
1 jan 1981 ano
5.748
+1.046
22.26%
1 jan 1982 ano
4.628
-1.119
-19.47%
1 jan 1983 ano
2.489
-2.14
-46.23%
1 jan 1984 ano
2.93
+0.441
17.72%
1 jan 1985 ano
3.513
+0.583
19.91%
1 jan 1986 ano
2.949
-0.565
-16.07%
1 jan 1987 ano
0.953
-1.996
-67.69%
1 jan 1988 ano
1.479
+0.526
55.18%
1 jan 1989 ano
1.196
-0.283
-19.11%
1 jan 1990 ano
3.073
+1.877
156.94%
1 jan 1991 ano
2.293
-0.779
-25.37%
1 jan 1992 ano
0.986
-1.307
-57.0%
1 jan 1993 ano
0.953
-0.033
-3.36%
1 jan 1994 ano
0.948
-0.005
-0.52%
1 jan 1995 ano
0.864
-0.084
-8.89%
1 jan 1996 ano
1.065
+0.201
23.29%
1 jan 1997 ano
1.447
+0.382
35.85%
1 jan 1998 ano
1.23
-0.216
-14.96%
1 jan 1999 ano
0.629
-0.601
-48.88%
1 jan 2000 ano
1.126
+0.496
78.93%
1 jan 2001 ano
2.101
+0.975
86.64%
1 jan 2002 ano
1.701
-0.4
-19.03%
1 jan 2003 ano
4.829
+3.128
183.88%
1 jan 2004 ano
4.28
-0.549
-11.36%
1 jan 2005 ano
4.466
+0.186
4.35%
1 jan 2006 ano
5.424
+0.958
21.45%
1 jan 2007 ano
5.886
+0.462
8.52%
1 jan 2008 ano
4.893
-0.993
-16.87%
1 jan 2009 ano
5.029
+0.136
2.78%
1 jan 2010 ano
2.864
-2.164
-43.04%
1 jan 2011 ano
3.121
+0.257
8.97%
1 jan 2012 ano
3.674
+0.553
17.71%
1 jan 2013 ano
3.457
-0.217
-5.92%
1 jan 2014 ano
2.966
-0.491
-14.21%
1 jan 2015 ano
2.931
-0.034
-1.16%
1 jan 2016 ano
1.186
-1.745
-59.52%
Classificação de países por estatísticas atuais por anos


Comentários: