29
/pt/
pt
AIzaSyAYiBZKx7MnpbEhh9jyipgxe19OcubqV5w
April 1, 2024
281772
Venezuela, RB
VEN
true
2
1
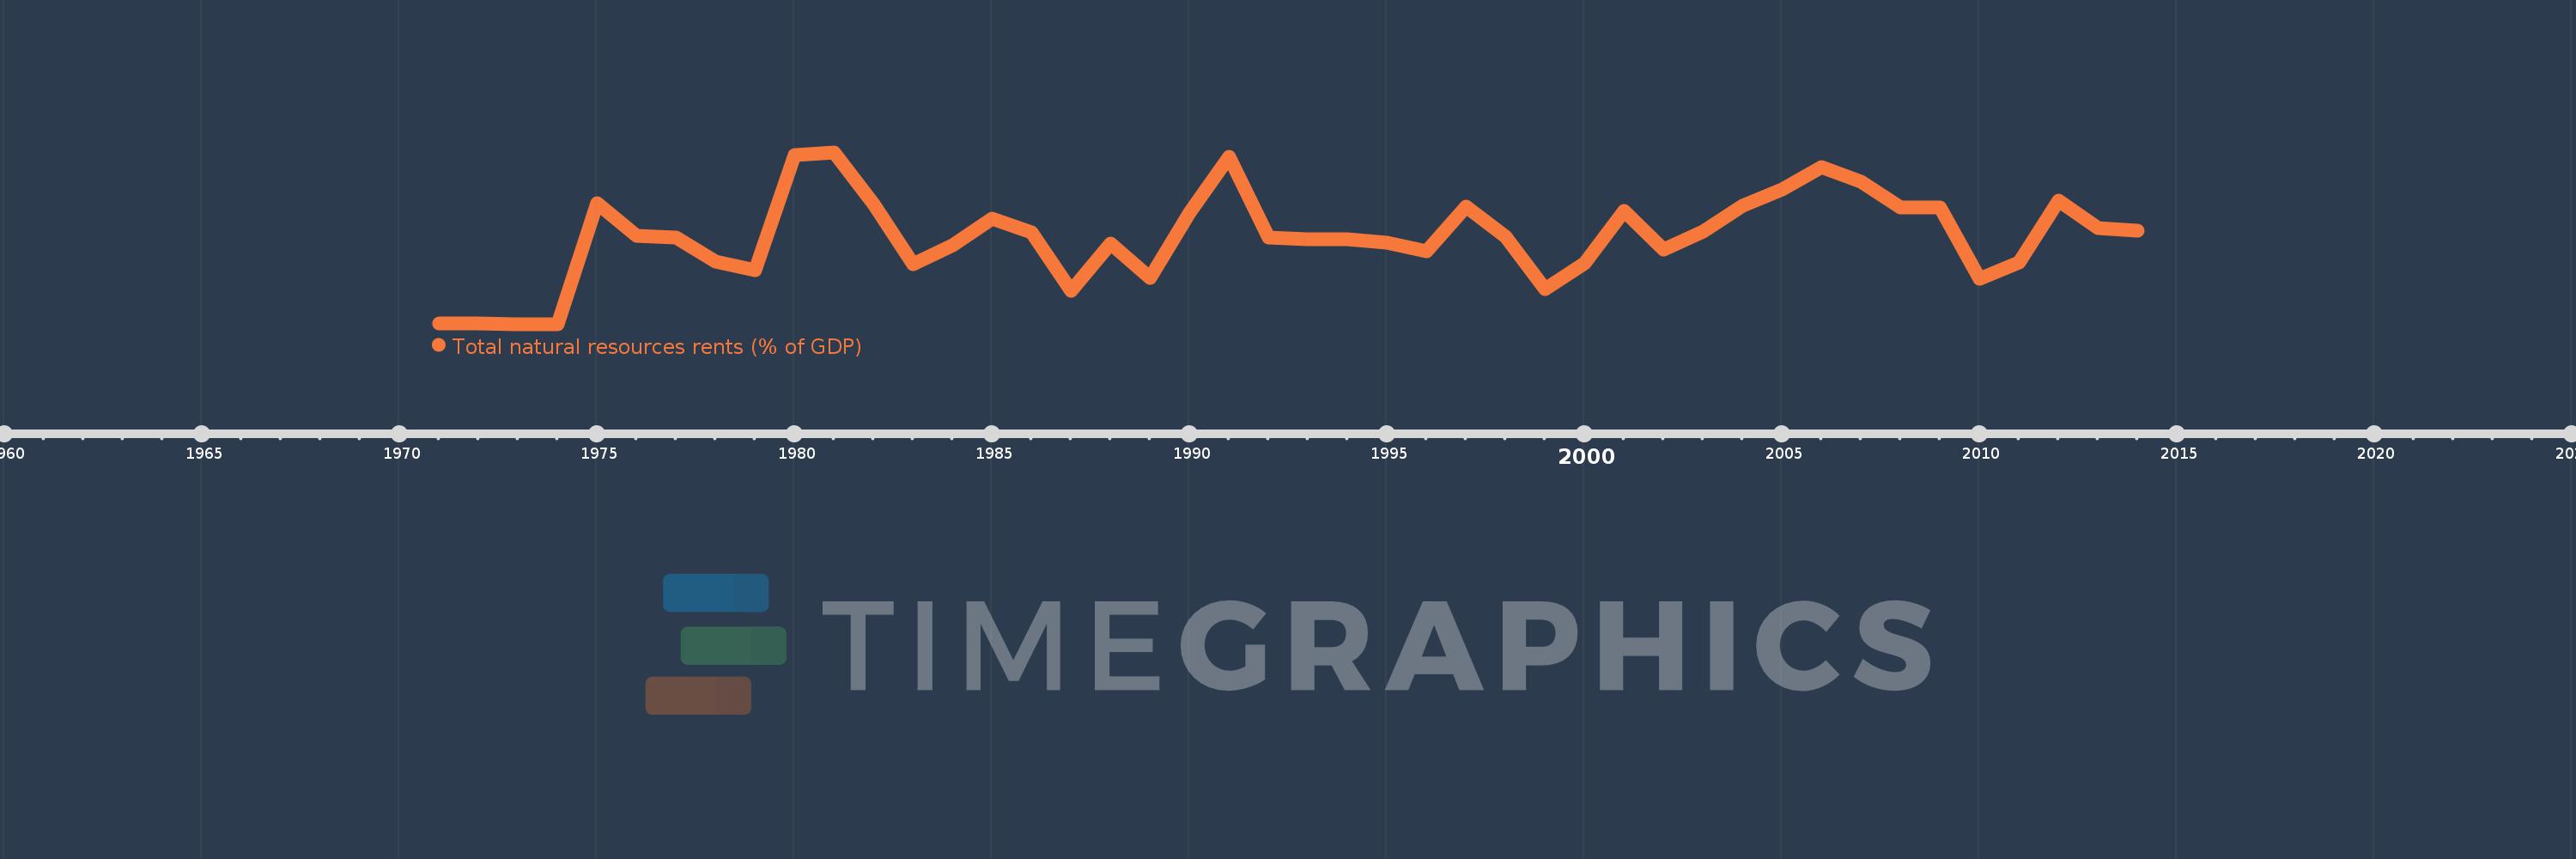
Total natural resources rents (% of GDP)
2014,2013,2012,2011,2010,2009,2008,2007,2006,2005,2004,2003,2002,2001,2000,1999,1998,1997,1996,1995,1994,1993,1992,1991,1990,1989,1988,1987,1986,1985,1984,1983,1982,1981,1980,1979,1978,1977,1976,1975,1974,1973,1972,1971
Estas estatísticas em outros países:
AfghanistanAlbaniaAlgeriaAngolaArab WorldArgentinaArmeniaArubaAustraliaAustriaAzerbaijanBahamas, TheBahrainBangladeshBarbadosBelarusBelgiumBelizeBeninBhutanBoliviaBosnia and HerzegovinaBotswanaBrazilBrunei DarussalamBulgariaBurkina FasoBurundiCabo VerdeCambodiaCameroonCanadaCaribbean small statesCentral African RepublicCentral Europe and the BalticsChadChileChinaColombiaComorosCongo, Dem. Rep.Congo, Rep.Costa RicaCote d'IvoireCroatiaCubaCyprusCzech RepublicDenmarkDjiboutiDominicaDominican RepublicEarly-demographic dividendEast Asia & PacificEast Asia & Pacific (excluding high income)East Asia & Pacific (IDA & IBRD countries)EcuadorEgypt, Arab Rep.El SalvadorEquatorial GuineaEritreaEstoniaEthiopiaEuro areaEurope & Central AsiaEurope & Central Asia (excluding high income)Europe & Central Asia (IDA & IBRD countries)European UnionFijiFinlandFragile and conflict affected situationsFranceFrench PolynesiaGabonGambia, TheGeorgiaGermanyGhanaGreeceGuatemalaGuineaGuinea-BissauGuyanaHaitiHeavily indebted poor countries (HIPC)High incomeHondurasHong Kong SAR, ChinaHungaryIBRD onlyIcelandIDA & IBRD totalIDA blendIDA onlyIDA totalIndiaIndonesiaIran, Islamic Rep.IraqIrelandIsraelItalyJamaicaJapanJordanKazakhstanKenyaKiribatiKorea, Rep.KuwaitKyrgyz RepublicLao PDRLate-demographic dividendLatin America & Caribbean Latin America & Caribbean (excluding high income)Latin America & the Caribbean (IDA & IBRD countries)LatviaLeast developed countries: UN classificationLebanonLesothoLiberiaLibyaLithuaniaLow & middle incomeLow incomeLower middle incomeLuxembourgMacao SAR, ChinaMacedonia, FYRMadagascarMalawiMalaysiaMaldivesMaliMaltaMauritaniaMauritiusMexicoMiddle East & North AfricaMiddle East & North Africa (excluding high income)Middle East & North Africa (IDA & IBRD countries)Middle incomeMoldovaMongoliaMontenegroMoroccoMozambiqueMyanmarNamibiaNepalNetherlandsNew CaledoniaNew ZealandNicaraguaNigerNigeriaNorth AmericaNorwayOECD membersOmanOther small statesPacific island small statesPakistanPanamaPapua New GuineaParaguayPeruPhilippinesPolandPortugalPost-demographic dividendPre-demographic dividendQatarRomaniaRussian FederationRwandaSamoaSao Tome and PrincipeSaudi ArabiaSenegalSerbiaSeychellesSierra LeoneSingaporeSlovak RepublicSloveniaSmall statesSolomon IslandsSouth AfricaSouth AsiaSouth Asia (IDA & IBRD)South SudanSpainSri LankaSt. LuciaSt. Vincent and the GrenadinesSub-Saharan Africa Sub-Saharan Africa (excluding high income)Sub-Saharan Africa (IDA & IBRD countries)SudanSurinameSwazilandSwedenSwitzerlandSyrian Arab RepublicTajikistanTanzaniaThailandTimor-LesteTogoTongaTrinidad and TobagoTunisiaTurkeyTurkmenistanUgandaUkraineUnited Arab EmiratesUnited KingdomUnited StatesUpper middle incomeUruguayUzbekistanVanuatuVenezuela, RBVietnamWorldYemen, Rep.ZambiaZimbabwe Linha do tempo:
Nesta escala de tempo está apresentado um gráfico de 1971 ano até 2014 ano Venezuela, RB. Dados de 1970 ano ausente. O número de observações reais por data: 44.
Fonte (nome):
Indicadores de desenvolvimento mundial
Fonte (organização):
Estimates based on sources and methods described in "The Changing Wealth of Nations: Measuring Sustainable Development in the New Millennium" (World Bank, 2011).
Categorias:
Energy & Mining, Environment
Foi atualizado:
23 abr 2017 ano
Indicadores de alterações dos valores ao longo dos anos
Mínimo:
0.42
1 jan 1973 ano
Máximo:
27.683
1 jan 1981 ano
Na data de observação
Valor
Mudança absoluta
A alteração em relação ao valor anterior
1 jan 1971 ano
0.603
+0.603
0.0%
1 jan 1972 ano
0.515
-0.088
-14.64%
1 jan 1973 ano
0.42
-0.094
-18.32%
1 jan 1974 ano
0.47
+0.049
11.75%
1 jan 1975 ano
19.637
+19.168
4.08 mil%
1 jan 1976 ano
14.447
-5.19
-26.43%
1 jan 1977 ano
14.177
-0.27
-1.87%
1 jan 1978 ano
10.416
-3.761
-26.53%
1 jan 1979 ano
9.026
-1.39
-13.34%
1 jan 1980 ano
27.22
+18.194
201.57%
1 jan 1981 ano
27.683
+0.462
1.7%
1 jan 1982 ano
19.451
-8.231
-29.74%
1 jan 1983 ano
9.935
-9.516
-48.92%
1 jan 1984 ano
12.925
+2.99
30.09%
1 jan 1985 ano
17.207
+4.281
33.12%
1 jan 1986 ano
14.988
-2.219
-12.9%
1 jan 1987 ano
5.782
-9.205
-61.42%
1 jan 1988 ano
13.179
+7.397
127.92%
1 jan 1989 ano
7.736
-5.443
-41.3%
1 jan 1990 ano
18.131
+10.395
134.37%
1 jan 1991 ano
26.951
+8.82
48.64%
1 jan 1992 ano
14.223
-12.729
-47.23%
1 jan 1993 ano
13.841
-0.382
-2.68%
1 jan 1994 ano
13.866
+0.024
0.18%
1 jan 1995 ano
13.348
-0.518
-3.74%
1 jan 1996 ano
12.02
-1.328
-9.95%
1 jan 1997 ano
19.024
+7.004
58.27%
1 jan 1998 ano
14.303
-4.721
-24.82%
1 jan 1999 ano
5.958
-8.344
-58.34%
1 jan 2000 ano
10.035
+4.077
68.43%
1 jan 2001 ano
18.371
+8.336
83.06%
1 jan 2002 ano
12.228
-6.143
-33.44%
1 jan 2003 ano
15.174
+2.946
24.09%
1 jan 2004 ano
19.187
+4.014
26.45%
1 jan 2005 ano
21.808
+2.62
13.66%
1 jan 2006 ano
25.414
+3.607
16.54%
1 jan 2007 ano
23.093
-2.321
-9.13%
1 jan 2008 ano
18.986
-4.107
-17.78%
1 jan 2009 ano
19.003
+0.017
0.09%
1 jan 2010 ano
7.678
-11.325
-59.6%
1 jan 2011 ano
10.206
+2.528
32.92%
1 jan 2012 ano
20.031
+9.826
96.27%
1 jan 2013 ano
15.727
-4.304
-21.49%
1 jan 2014 ano
15.253
-0.474
-3.02%
Classificação de países por estatísticas atuais por anos


Comentários: