29
/pt/
pt
AIzaSyAYiBZKx7MnpbEhh9jyipgxe19OcubqV5w
April 1, 2024
125628
Egypt, Arab Rep.
EGY
true
2
1
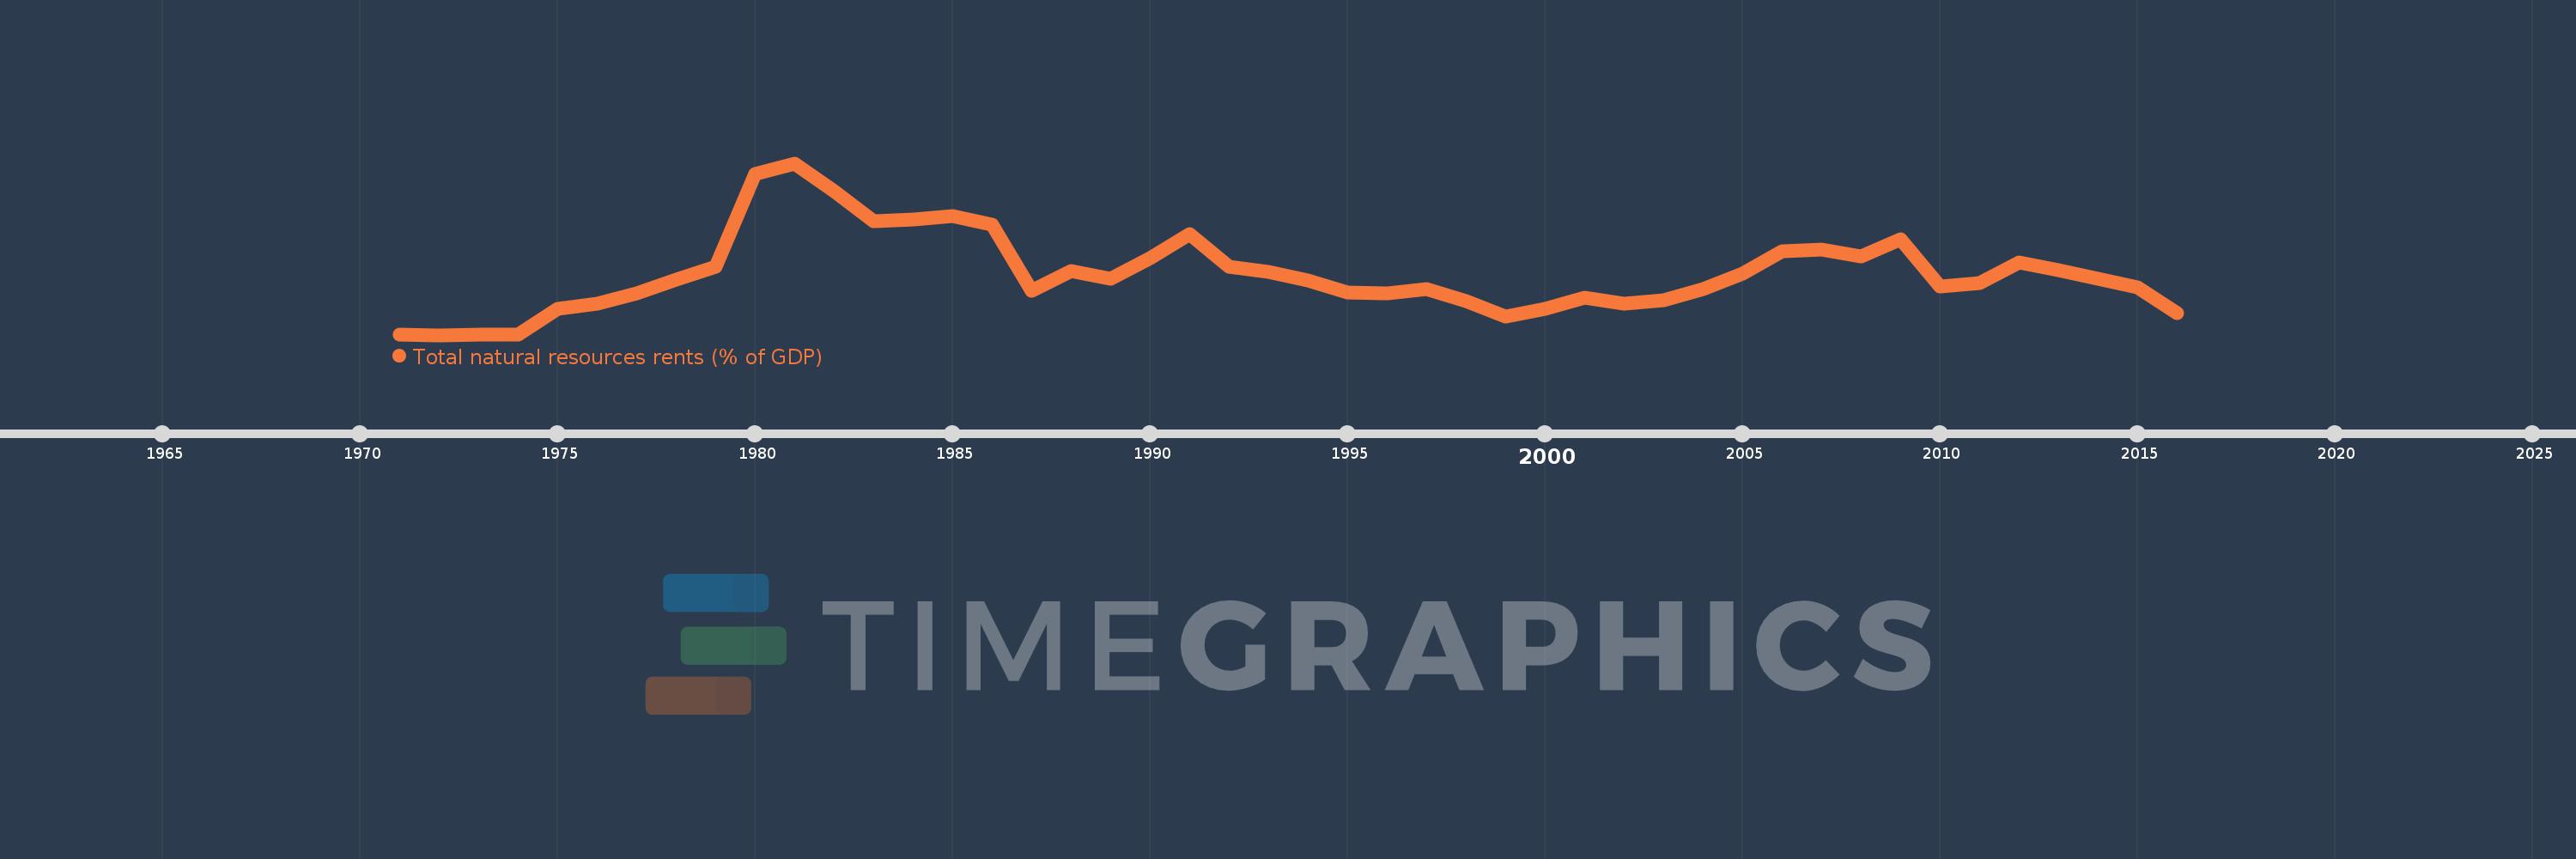
Total natural resources rents (% of GDP)
2016,2015,2014,2013,2012,2011,2010,2009,2008,2007,2006,2005,2004,2003,2002,2001,2000,1999,1998,1997,1996,1995,1994,1993,1992,1991,1990,1989,1988,1987,1986,1985,1984,1983,1982,1981,1980,1979,1978,1977,1976,1975,1974,1973,1972,1971
Estas estatísticas em outros países:
AfghanistanAlbaniaAlgeriaAngolaArab WorldArgentinaArmeniaArubaAustraliaAustriaAzerbaijanBahamas, TheBahrainBangladeshBarbadosBelarusBelgiumBelizeBeninBhutanBoliviaBosnia and HerzegovinaBotswanaBrazilBrunei DarussalamBulgariaBurkina FasoBurundiCabo VerdeCambodiaCameroonCanadaCaribbean small statesCentral African RepublicCentral Europe and the BalticsChadChileChinaColombiaComorosCongo, Dem. Rep.Congo, Rep.Costa RicaCote d'IvoireCroatiaCubaCyprusCzech RepublicDenmarkDjiboutiDominicaDominican RepublicEarly-demographic dividendEast Asia & PacificEast Asia & Pacific (excluding high income)East Asia & Pacific (IDA & IBRD countries)EcuadorEgypt, Arab Rep.El SalvadorEquatorial GuineaEritreaEstoniaEthiopiaEuro areaEurope & Central AsiaEurope & Central Asia (excluding high income)Europe & Central Asia (IDA & IBRD countries)European UnionFijiFinlandFragile and conflict affected situationsFranceFrench PolynesiaGabonGambia, TheGeorgiaGermanyGhanaGreeceGuatemalaGuineaGuinea-BissauGuyanaHaitiHeavily indebted poor countries (HIPC)High incomeHondurasHong Kong SAR, ChinaHungaryIBRD onlyIcelandIDA & IBRD totalIDA blendIDA onlyIDA totalIndiaIndonesiaIran, Islamic Rep.IraqIrelandIsraelItalyJamaicaJapanJordanKazakhstanKenyaKiribatiKorea, Rep.KuwaitKyrgyz RepublicLao PDRLate-demographic dividendLatin America & Caribbean Latin America & Caribbean (excluding high income)Latin America & the Caribbean (IDA & IBRD countries)LatviaLeast developed countries: UN classificationLebanonLesothoLiberiaLibyaLithuaniaLow & middle incomeLow incomeLower middle incomeLuxembourgMacao SAR, ChinaMacedonia, FYRMadagascarMalawiMalaysiaMaldivesMaliMaltaMauritaniaMauritiusMexicoMiddle East & North AfricaMiddle East & North Africa (excluding high income)Middle East & North Africa (IDA & IBRD countries)Middle incomeMoldovaMongoliaMontenegroMoroccoMozambiqueMyanmarNamibiaNepalNetherlandsNew CaledoniaNew ZealandNicaraguaNigerNigeriaNorth AmericaNorwayOECD membersOmanOther small statesPacific island small statesPakistanPanamaPapua New GuineaParaguayPeruPhilippinesPolandPortugalPost-demographic dividendPre-demographic dividendQatarRomaniaRussian FederationRwandaSamoaSao Tome and PrincipeSaudi ArabiaSenegalSerbiaSeychellesSierra LeoneSingaporeSlovak RepublicSloveniaSmall statesSolomon IslandsSouth AfricaSouth AsiaSouth Asia (IDA & IBRD)South SudanSpainSri LankaSt. LuciaSt. Vincent and the GrenadinesSub-Saharan Africa Sub-Saharan Africa (excluding high income)Sub-Saharan Africa (IDA & IBRD countries)SudanSurinameSwazilandSwedenSwitzerlandSyrian Arab RepublicTajikistanTanzaniaThailandTimor-LesteTogoTongaTrinidad and TobagoTunisiaTurkeyTurkmenistanUgandaUkraineUnited Arab EmiratesUnited KingdomUnited StatesUpper middle incomeUruguayUzbekistanVanuatuVenezuela, RBVietnamWorldYemen, Rep.ZambiaZimbabwe Linha do tempo:
Nesta escala de tempo está apresentado um gráfico de 1971 ano até 2016 ano Egypt, Arab Rep.. Dados de 1970 ano ausente. O número de observações reais por data: 46.
Fonte (nome):
Indicadores de desenvolvimento mundial
Fonte (organização):
Estimates based on sources and methods described in "The Changing Wealth of Nations: Measuring Sustainable Development in the New Millennium" (World Bank, 2011).
Categorias:
Energy & Mining, Environment
Foi atualizado:
23 abr 2017 ano
Indicadores de alterações dos valores ao longo dos anos
Mínimo:
0.32
1 jan 1972 ano
Máximo:
28.105
1 jan 1981 ano
Na data de observação
Valor
Mudança absoluta
A alteração em relação ao valor anterior
1 jan 1971 ano
0.377
+0.377
0.0%
1 jan 1972 ano
0.32
-0.057
-15.06%
1 jan 1973 ano
0.35
+0.03
9.37%
1 jan 1974 ano
0.432
+0.082
23.33%
1 jan 1975 ano
4.597
+4.165
965.15%
1 jan 1976 ano
5.46
+0.863
18.77%
1 jan 1977 ano
7.053
+1.593
29.18%
1 jan 1978 ano
9.287
+2.234
31.67%
1 jan 1979 ano
11.337
+2.05
22.08%
1 jan 1980 ano
26.359
+15.022
132.51%
1 jan 1981 ano
28.105
+1.746
6.62%
1 jan 1982 ano
23.538
-4.567
-16.25%
1 jan 1983 ano
18.659
-4.879
-20.73%
1 jan 1984 ano
19.071
+0.412
2.21%
1 jan 1985 ano
19.626
+0.555
2.91%
1 jan 1986 ano
18.118
-1.508
-7.69%
1 jan 1987 ano
7.41
-10.707
-59.1%
1 jan 1988 ano
10.643
+3.233
43.62%
1 jan 1989 ano
9.453
-1.19
-11.18%
1 jan 1990 ano
12.738
+3.285
34.75%
1 jan 1991 ano
16.617
+3.879
30.45%
1 jan 1992 ano
11.386
-5.231
-31.48%
1 jan 1993 ano
10.532
-0.854
-7.5%
1 jan 1994 ano
9.082
-1.451
-13.77%
1 jan 1995 ano
7.177
-1.905
-20.98%
1 jan 1996 ano
7.001
-0.175
-2.44%
1 jan 1997 ano
7.748
+0.746
10.66%
1 jan 1998 ano
5.847
-1.901
-24.54%
1 jan 1999 ano
3.267
-2.58
-44.13%
1 jan 2000 ano
4.59
+1.323
40.5%
1 jan 2001 ano
6.299
+1.709
37.25%
1 jan 2002 ano
5.34
-0.959
-15.22%
1 jan 2003 ano
6.006
+0.666
12.47%
1 jan 2004 ano
7.807
+1.801
29.98%
1 jan 2005 ano
10.245
+2.438
31.23%
1 jan 2006 ano
13.911
+3.666
35.78%
1 jan 2007 ano
14.201
+0.29
2.08%
1 jan 2008 ano
12.987
-1.213
-8.54%
1 jan 2009 ano
15.749
+2.761
21.26%
1 jan 2010 ano
8.214
-7.535
-47.85%
1 jan 2011 ano
8.7
+0.486
5.92%
1 jan 2012 ano
12.044
+3.344
38.44%
1 jan 2013 ano
10.832
-1.213
-10.07%
1 jan 2014 ano
9.461
-1.37
-12.65%
1 jan 2015 ano
7.98
-1.481
-15.66%
1 jan 2016 ano
3.85
-4.13
-51.75%
Classificação de países por estatísticas atuais por anos


Comentários: