29
/pt/
pt
AIzaSyAYiBZKx7MnpbEhh9jyipgxe19OcubqV5w
April 1, 2024
113080
Costa Rica
CRI
true
2
1
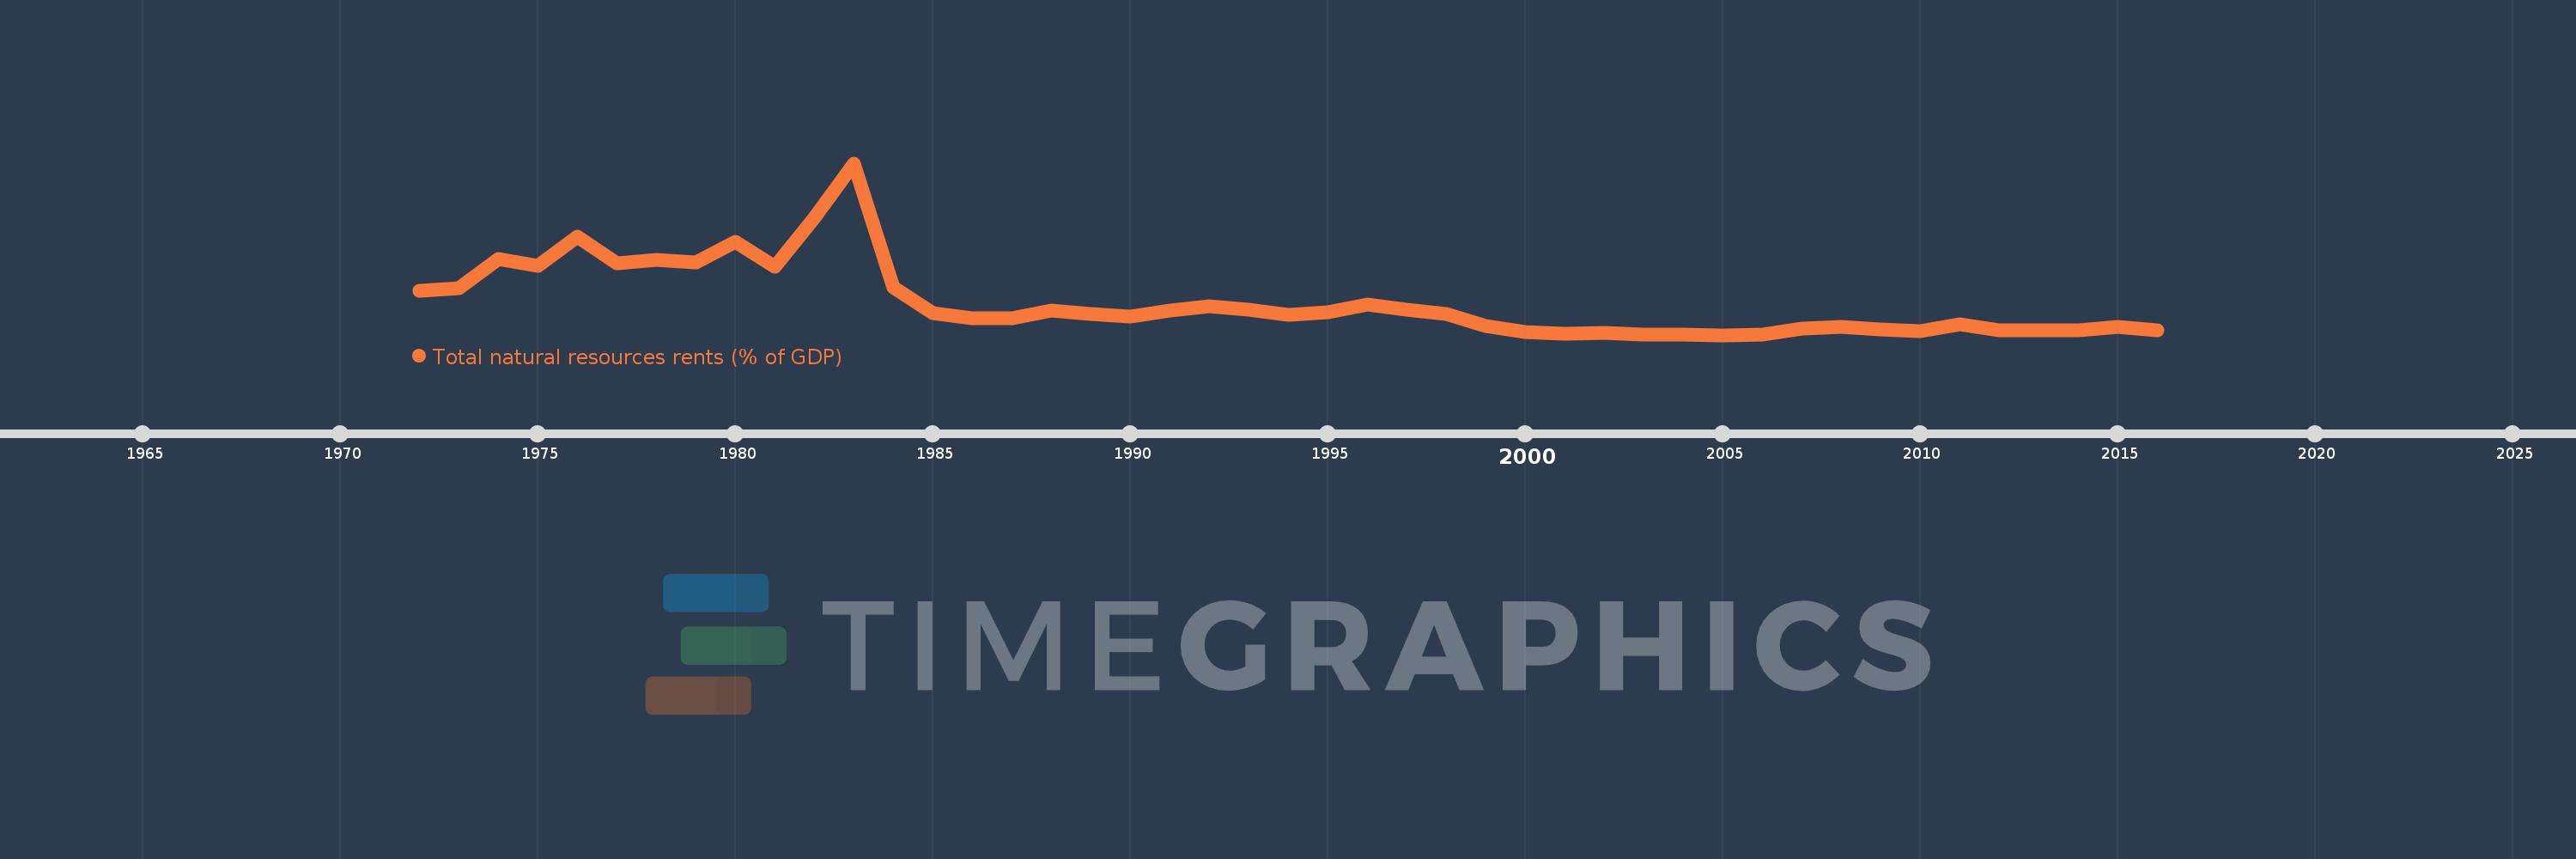
Total natural resources rents (% of GDP)
2016,2015,2014,2013,2012,2011,2010,2009,2008,2007,2006,2005,2004,2003,2002,2001,2000,1999,1998,1997,1996,1995,1994,1993,1992,1991,1990,1989,1988,1987,1986,1985,1984,1983,1982,1981,1980,1979,1978,1977,1976,1975,1974,1973,1972
Estas estatísticas em outros países:
AfghanistanAlbaniaAlgeriaAngolaArab WorldArgentinaArmeniaArubaAustraliaAustriaAzerbaijanBahamas, TheBahrainBangladeshBarbadosBelarusBelgiumBelizeBeninBhutanBoliviaBosnia and HerzegovinaBotswanaBrazilBrunei DarussalamBulgariaBurkina FasoBurundiCabo VerdeCambodiaCameroonCanadaCaribbean small statesCentral African RepublicCentral Europe and the BalticsChadChileChinaColombiaComorosCongo, Dem. Rep.Congo, Rep.Costa RicaCote d'IvoireCroatiaCubaCyprusCzech RepublicDenmarkDjiboutiDominicaDominican RepublicEarly-demographic dividendEast Asia & PacificEast Asia & Pacific (excluding high income)East Asia & Pacific (IDA & IBRD countries)EcuadorEgypt, Arab Rep.El SalvadorEquatorial GuineaEritreaEstoniaEthiopiaEuro areaEurope & Central AsiaEurope & Central Asia (excluding high income)Europe & Central Asia (IDA & IBRD countries)European UnionFijiFinlandFragile and conflict affected situationsFranceFrench PolynesiaGabonGambia, TheGeorgiaGermanyGhanaGreeceGuatemalaGuineaGuinea-BissauGuyanaHaitiHeavily indebted poor countries (HIPC)High incomeHondurasHong Kong SAR, ChinaHungaryIBRD onlyIcelandIDA & IBRD totalIDA blendIDA onlyIDA totalIndiaIndonesiaIran, Islamic Rep.IraqIrelandIsraelItalyJamaicaJapanJordanKazakhstanKenyaKiribatiKorea, Rep.KuwaitKyrgyz RepublicLao PDRLate-demographic dividendLatin America & Caribbean Latin America & Caribbean (excluding high income)Latin America & the Caribbean (IDA & IBRD countries)LatviaLeast developed countries: UN classificationLebanonLesothoLiberiaLibyaLithuaniaLow & middle incomeLow incomeLower middle incomeLuxembourgMacao SAR, ChinaMacedonia, FYRMadagascarMalawiMalaysiaMaldivesMaliMaltaMauritaniaMauritiusMexicoMiddle East & North AfricaMiddle East & North Africa (excluding high income)Middle East & North Africa (IDA & IBRD countries)Middle incomeMoldovaMongoliaMontenegroMoroccoMozambiqueMyanmarNamibiaNepalNetherlandsNew CaledoniaNew ZealandNicaraguaNigerNigeriaNorth AmericaNorwayOECD membersOmanOther small statesPacific island small statesPakistanPanamaPapua New GuineaParaguayPeruPhilippinesPolandPortugalPost-demographic dividendPre-demographic dividendQatarRomaniaRussian FederationRwandaSamoaSao Tome and PrincipeSaudi ArabiaSenegalSerbiaSeychellesSierra LeoneSingaporeSlovak RepublicSloveniaSmall statesSolomon IslandsSouth AfricaSouth AsiaSouth Asia (IDA & IBRD)South SudanSpainSri LankaSt. LuciaSt. Vincent and the GrenadinesSub-Saharan Africa Sub-Saharan Africa (excluding high income)Sub-Saharan Africa (IDA & IBRD countries)SudanSurinameSwazilandSwedenSwitzerlandSyrian Arab RepublicTajikistanTanzaniaThailandTimor-LesteTogoTongaTrinidad and TobagoTunisiaTurkeyTurkmenistanUgandaUkraineUnited Arab EmiratesUnited KingdomUnited StatesUpper middle incomeUruguayUzbekistanVanuatuVenezuela, RBVietnamWorldYemen, Rep.ZambiaZimbabwe Linha do tempo:
Nesta escala de tempo está apresentado um gráfico de 1972 ano até 2016 ano Costa Rica. Dados de 1971 ano ausente. O número de observações reais por data: 45.
Fonte (nome):
Indicadores de desenvolvimento mundial
Fonte (organização):
Estimates based on sources and methods described in "The Changing Wealth of Nations: Measuring Sustainable Development in the New Millennium" (World Bank, 2011).
Categorias:
Energy & Mining, Environment
Foi atualizado:
23 abr 2017 ano
Indicadores de alterações dos valores ao longo dos anos
Mínimo:
0.939
1 jan 2005 ano
Máximo:
12.01
1 jan 1983 ano
Na data de observação
Valor
Mudança absoluta
A alteração em relação ao valor anterior
1 jan 1972 ano
3.814
+3.814
0.0%
1 jan 1973 ano
3.968
+0.154
4.05%
1 jan 1974 ano
5.863
+1.895
47.75%
1 jan 1975 ano
5.39
-0.473
-8.07%
1 jan 1976 ano
7.255
+1.865
34.6%
1 jan 1977 ano
5.571
-1.685
-23.22%
1 jan 1978 ano
5.778
+0.208
3.73%
1 jan 1979 ano
5.626
-0.152
-2.63%
1 jan 1980 ano
6.96
+1.333
23.7%
1 jan 1981 ano
5.353
-1.607
-23.09%
1 jan 1982 ano
8.516
+3.163
59.09%
1 jan 1983 ano
12.01
+3.494
41.03%
1 jan 1984 ano
4.02
-7.991
-66.53%
1 jan 1985 ano
2.341
-1.679
-41.77%
1 jan 1986 ano
1.997
-0.344
-14.69%
1 jan 1987 ano
2.029
+0.033
1.63%
1 jan 1988 ano
2.528
+0.498
24.55%
1 jan 1989 ano
2.32
-0.208
-8.23%
1 jan 1990 ano
2.15
-0.169
-7.3%
1 jan 1991 ano
2.541
+0.391
18.17%
1 jan 1992 ano
2.769
+0.228
8.96%
1 jan 1993 ano
2.582
-0.187
-6.74%
1 jan 1994 ano
2.214
-0.368
-14.26%
1 jan 1995 ano
2.381
+0.167
7.55%
1 jan 1996 ano
2.902
+0.522
21.91%
1 jan 1997 ano
2.572
-0.331
-11.4%
1 jan 1998 ano
2.288
-0.284
-11.03%
1 jan 1999 ano
1.52
-0.768
-33.56%
1 jan 2000 ano
1.157
-0.363
-23.87%
1 jan 2001 ano
1.018
-0.139
-12.03%
1 jan 2002 ano
1.055
+0.037
3.61%
1 jan 2003 ano
0.954
-0.101
-9.55%
1 jan 2004 ano
0.986
+0.031
3.29%
1 jan 2005 ano
0.939
-0.046
-4.67%
1 jan 2006 ano
0.972
+0.032
3.45%
1 jan 2007 ano
1.329
+0.358
36.79%
1 jan 2008 ano
1.447
+0.117
8.84%
1 jan 2009 ano
1.316
-0.13
-9.01%
1 jan 2010 ano
1.194
-0.122
-9.3%
1 jan 2011 ano
1.647
+0.453
37.93%
1 jan 2012 ano
1.243
-0.403
-24.5%
1 jan 2013 ano
1.216
-0.028
-2.23%
1 jan 2014 ano
1.239
+0.024
1.95%
1 jan 2015 ano
1.457
+0.217
17.54%
1 jan 2016 ano
1.256
-0.201
-13.77%
Classificação de países por estatísticas atuais por anos


Comentários: