29
/pt/
pt
AIzaSyAYiBZKx7MnpbEhh9jyipgxe19OcubqV5w
April 1, 2024
63934
Afghanistan
AFG
true
2
1
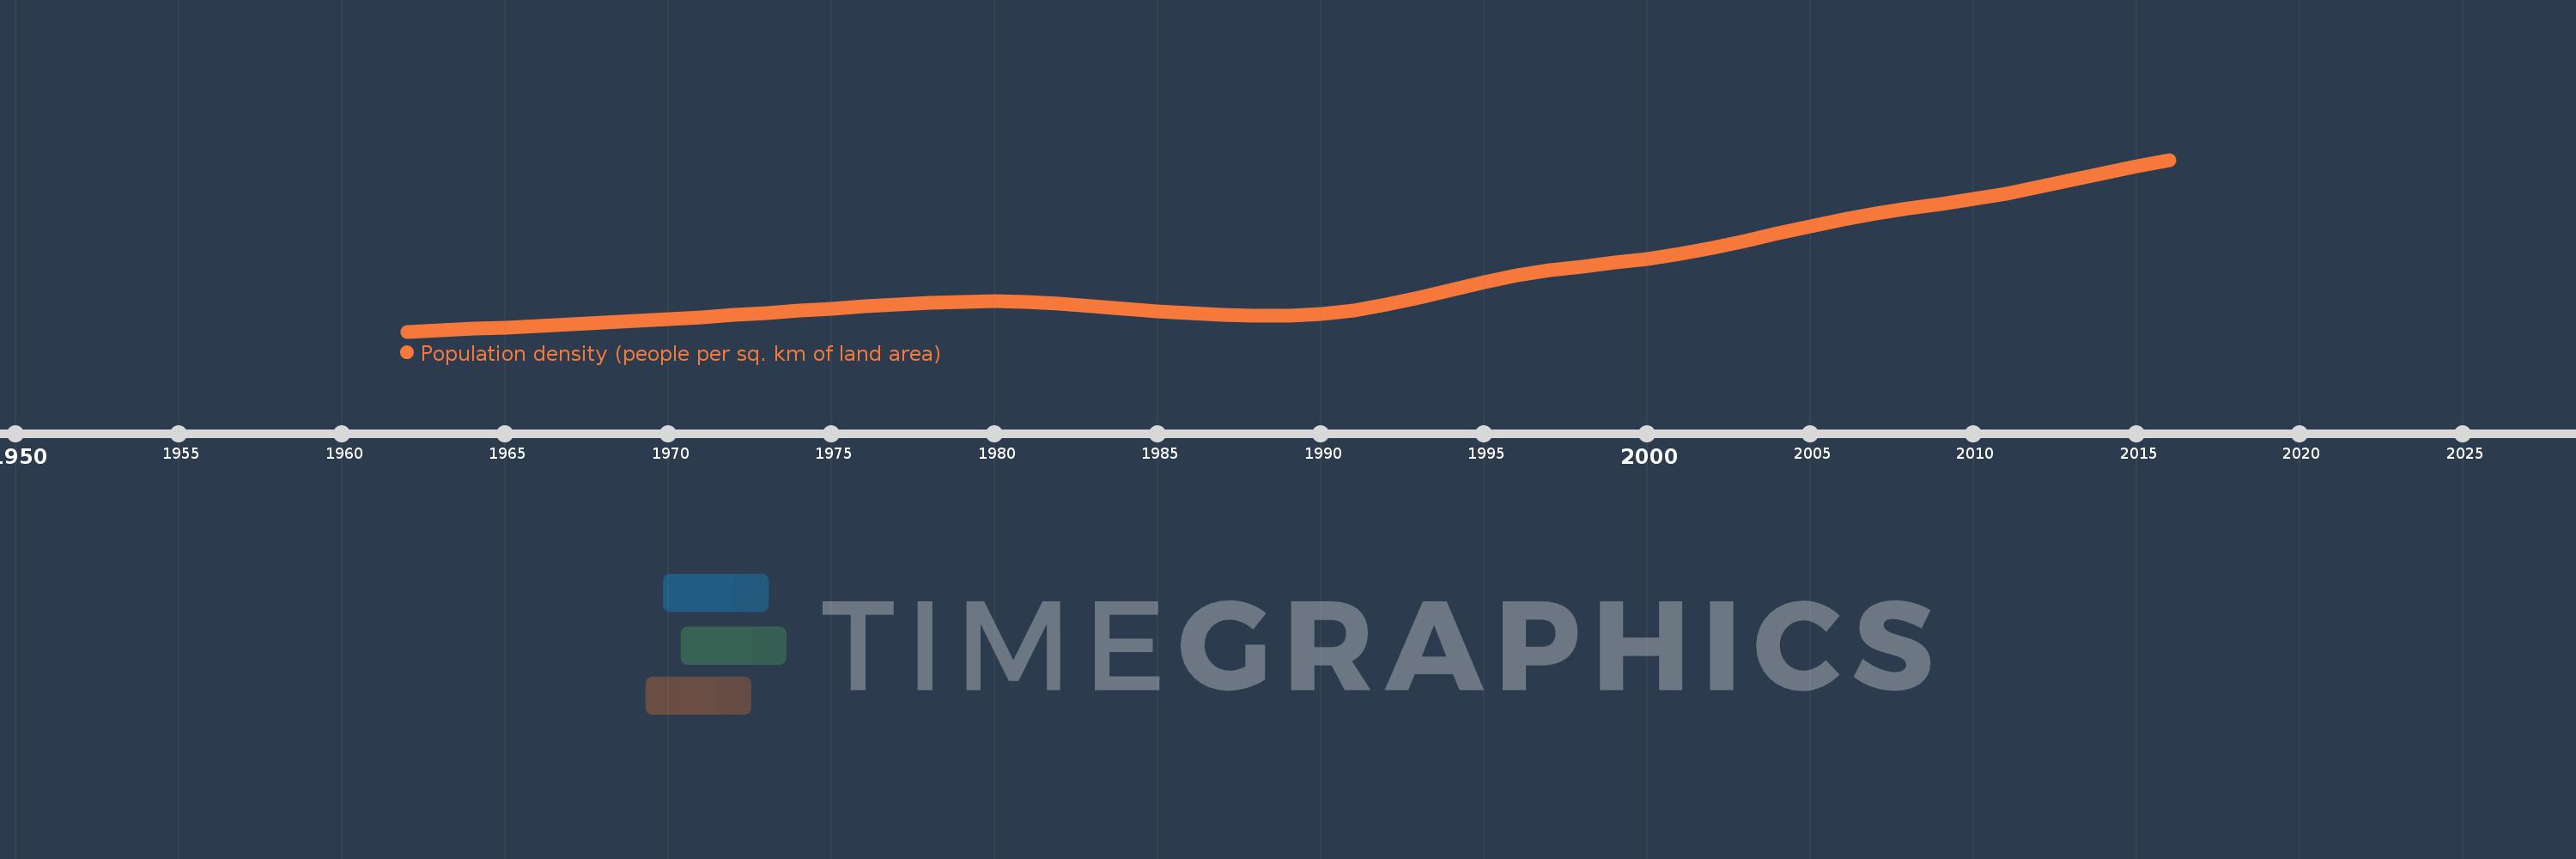
Population density (people per sq. km of land area)
2016,2015,2014,2013,2012,2011,2010,2009,2008,2007,2006,2005,2004,2003,2002,2001,2000,1999,1998,1997,1996,1995,1994,1993,1992,1991,1990,1989,1988,1987,1986,1985,1984,1983,1982,1981,1980,1979,1978,1977,1976,1975,1974,1973,1972,1971,1970,1969,1968,1967,1966,1965,1964,1963,1962
Estas estatísticas em outros países:
AfghanistanAlbaniaAlgeriaAmerican SamoaAndorraAngolaAntigua and BarbudaArab WorldArgentinaArmeniaArubaAustraliaAustriaAzerbaijanBahamas, TheBahrainBangladeshBarbadosBelarusBelgiumBelizeBeninBermudaBhutanBoliviaBosnia and HerzegovinaBotswanaBrazilBritish Virgin IslandsBrunei DarussalamBulgariaBurkina FasoBurundiCabo VerdeCambodiaCameroonCanadaCaribbean small statesCayman IslandsCentral African RepublicCentral Europe and the BalticsChadChannel IslandsChileChinaColombiaComorosCongo, Dem. Rep.Congo, Rep.Costa RicaCote d'IvoireCroatiaCubaCuracaoCyprusCzech RepublicDenmarkDjiboutiDominicaDominican RepublicEarly-demographic dividendEast Asia & PacificEast Asia & Pacific (excluding high income)East Asia & Pacific (IDA & IBRD countries)EcuadorEgypt, Arab Rep.El SalvadorEquatorial GuineaEritreaEstoniaEthiopiaEuro areaEurope & Central AsiaEurope & Central Asia (excluding high income)Europe & Central Asia (IDA & IBRD countries)European UnionFaroe IslandsFijiFinlandFragile and conflict affected situationsFranceFrench PolynesiaGabonGambia, TheGeorgiaGermanyGhanaGibraltarGreeceGreenlandGrenadaGuamGuatemalaGuineaGuinea-BissauGuyanaHaitiHeavily indebted poor countries (HIPC)High incomeHondurasHong Kong SAR, ChinaHungaryIBRD onlyIcelandIDA & IBRD totalIDA blendIDA onlyIDA totalIndiaIndonesiaIran, Islamic Rep.IraqIrelandIsle of ManIsraelItalyJamaicaJapanJordanKazakhstanKenyaKiribatiKorea, Dem. People’s Rep.Korea, Rep.KosovoKuwaitKyrgyz RepublicLao PDRLate-demographic dividendLatin America & Caribbean Latin America & Caribbean (excluding high income)Latin America & the Caribbean (IDA & IBRD countries)LatviaLeast developed countries: UN classificationLebanonLesothoLiberiaLibyaLiechtensteinLithuaniaLow & middle incomeLow incomeLower middle incomeLuxembourgMacao SAR, ChinaMacedonia, FYRMadagascarMalawiMalaysiaMaldivesMaliMaltaMarshall IslandsMauritaniaMauritiusMexicoMicronesia, Fed. Sts.Middle East & North AfricaMiddle East & North Africa (excluding high income)Middle East & North Africa (IDA & IBRD countries)Middle incomeMoldovaMonacoMongoliaMontenegroMoroccoMozambiqueMyanmarNamibiaNauruNepalNetherlandsNew CaledoniaNew ZealandNicaraguaNigerNigeriaNorth AmericaNorthern Mariana IslandsNorwayOECD membersOmanOther small statesPacific island small statesPakistanPalauPanamaPapua New GuineaParaguayPeruPhilippinesPolandPortugalPost-demographic dividendPre-demographic dividendPuerto RicoQatarRomaniaRussian FederationRwandaSamoaSan MarinoSao Tome and PrincipeSaudi ArabiaSenegalSerbiaSeychellesSierra LeoneSingaporeSint Maarten (Dutch part)Slovak RepublicSloveniaSmall statesSolomon IslandsSomaliaSouth AfricaSouth AsiaSouth Asia (IDA & IBRD)SpainSri LankaSt. Kitts and NevisSt. LuciaSt. Martin (French part)St. Vincent and the GrenadinesSub-Saharan Africa Sub-Saharan Africa (excluding high income)Sub-Saharan Africa (IDA & IBRD countries)SudanSurinameSwazilandSwedenSwitzerlandSyrian Arab RepublicTajikistanTanzaniaThailandTimor-LesteTogoTongaTrinidad and TobagoTunisiaTurkeyTurkmenistanTurks and Caicos IslandsTuvaluUgandaUkraineUnited Arab EmiratesUnited KingdomUnited StatesUpper middle incomeUruguayUzbekistanVanuatuVenezuela, RBVietnamVirgin Islands (U.S.)West Bank and GazaWorldYemen, Rep.ZambiaZimbabwe Linha do tempo:
Nesta escala de tempo está apresentado um gráfico de 1962 ano até 2016 ano Afghanistan. Dados de 1961 ano ausente. O número de observações reais por data: 55.
Fonte (nome):
Indicadores de desenvolvimento mundial
Fonte (organização):
Food and Agriculture Organization and World Bank population estimates.
Categorias:
Urban Development
Foi atualizado:
23 abr 2017 ano
Indicadores de alterações dos valores ao longo dos anos
Mínimo:
14.038
1 jan 1962 ano
Máximo:
49.822
1 jan 2016 ano
Na data de observação
Valor
Mudança absoluta
A alteração em relação ao valor anterior
1 jan 1962 ano
14.038
+14.038
0.0%
1 jan 1963 ano
14.312
+0.274
1.95%
1 jan 1964 ano
14.6
+0.288
2.01%
1 jan 1965 ano
14.902
+0.302
2.07%
1 jan 1966 ano
15.218
+0.317
2.12%
1 jan 1967 ano
15.545
+0.327
2.15%
1 jan 1968 ano
15.882
+0.337
2.17%
1 jan 1969 ano
16.236
+0.354
2.23%
1 jan 1970 ano
16.618
+0.383
2.36%
1 jan 1971 ano
17.034
+0.416
2.5%
1 jan 1972 ano
17.481
+0.447
2.62%
1 jan 1973 ano
17.947
+0.466
2.66%
1 jan 1974 ano
18.415
+0.468
2.61%
1 jan 1975 ano
18.864
+0.449
2.44%
1 jan 1976 ano
19.274
+0.41
2.17%
1 jan 1977 ano
19.654
+0.38
1.97%
1 jan 1978 ano
19.999
+0.345
1.75%
1 jan 1979 ano
20.253
+0.254
1.27%
1 jan 1980 ano
20.346
+0.093
0.46%
1 jan 1981 ano
20.236
-0.11
-0.54%
1 jan 1982 ano
19.908
-0.329
-1.62%
1 jan 1983 ano
19.402
-0.505
-2.54%
1 jan 1984 ano
18.808
-0.594
-3.06%
1 jan 1985 ano
18.247
-0.562
-2.99%
1 jan 1986 ano
17.815
-0.432
-2.37%
1 jan 1987 ano
17.521
-0.293
-1.65%
1 jan 1988 ano
17.367
-0.155
-0.88%
1 jan 1989 ano
17.425
+0.058
0.33%
1 jan 1990 ano
17.781
+0.356
2.04%
1 jan 1991 ano
18.484
+0.703
3.96%
1 jan 1992 ano
19.59
+1.106
5.98%
1 jan 1993 ano
21.054
+1.465
7.48%
1 jan 1994 ano
22.707
+1.652
7.85%
1 jan 1995 ano
24.308
+1.602
7.05%
1 jan 1996 ano
25.691
+1.382
5.69%
1 jan 1997 ano
26.777
+1.086
4.23%
1 jan 1998 ano
27.623
+0.846
3.16%
1 jan 1999 ano
28.354
+0.731
2.65%
1 jan 2000 ano
29.162
+0.807
2.85%
1 jan 2001 ano
30.178
+1.016
3.49%
1 jan 2002 ano
31.448
+1.27
4.21%
1 jan 2003 ano
32.912
+1.464
4.66%
1 jan 2004 ano
34.475
+1.563
4.75%
1 jan 2005 ano
35.995
+1.52
4.41%
1 jan 2006 ano
37.374
+1.379
3.83%
1 jan 2007 ano
38.574
+1.2
3.21%
1 jan 2008 ano
39.637
+1.063
2.76%
1 jan 2009 ano
40.635
+0.997
2.52%
1 jan 2010 ano
41.674
+1.039
2.56%
1 jan 2011 ano
42.83
+1.156
2.77%
1 jan 2012 ano
44.128
+1.297
3.03%
1 jan 2013 ano
45.533
+1.406
3.19%
1 jan 2014 ano
46.997
+1.464
3.21%
1 jan 2015 ano
48.445
+1.447
3.08%
1 jan 2016 ano
49.822
+1.377
2.84%
Classificação de países por estatísticas atuais por anos


Comentários: