29
/pt/
pt
AIzaSyAYiBZKx7MnpbEhh9jyipgxe19OcubqV5w
April 1, 2024
144891
Guatemala
GTM
true
2
1
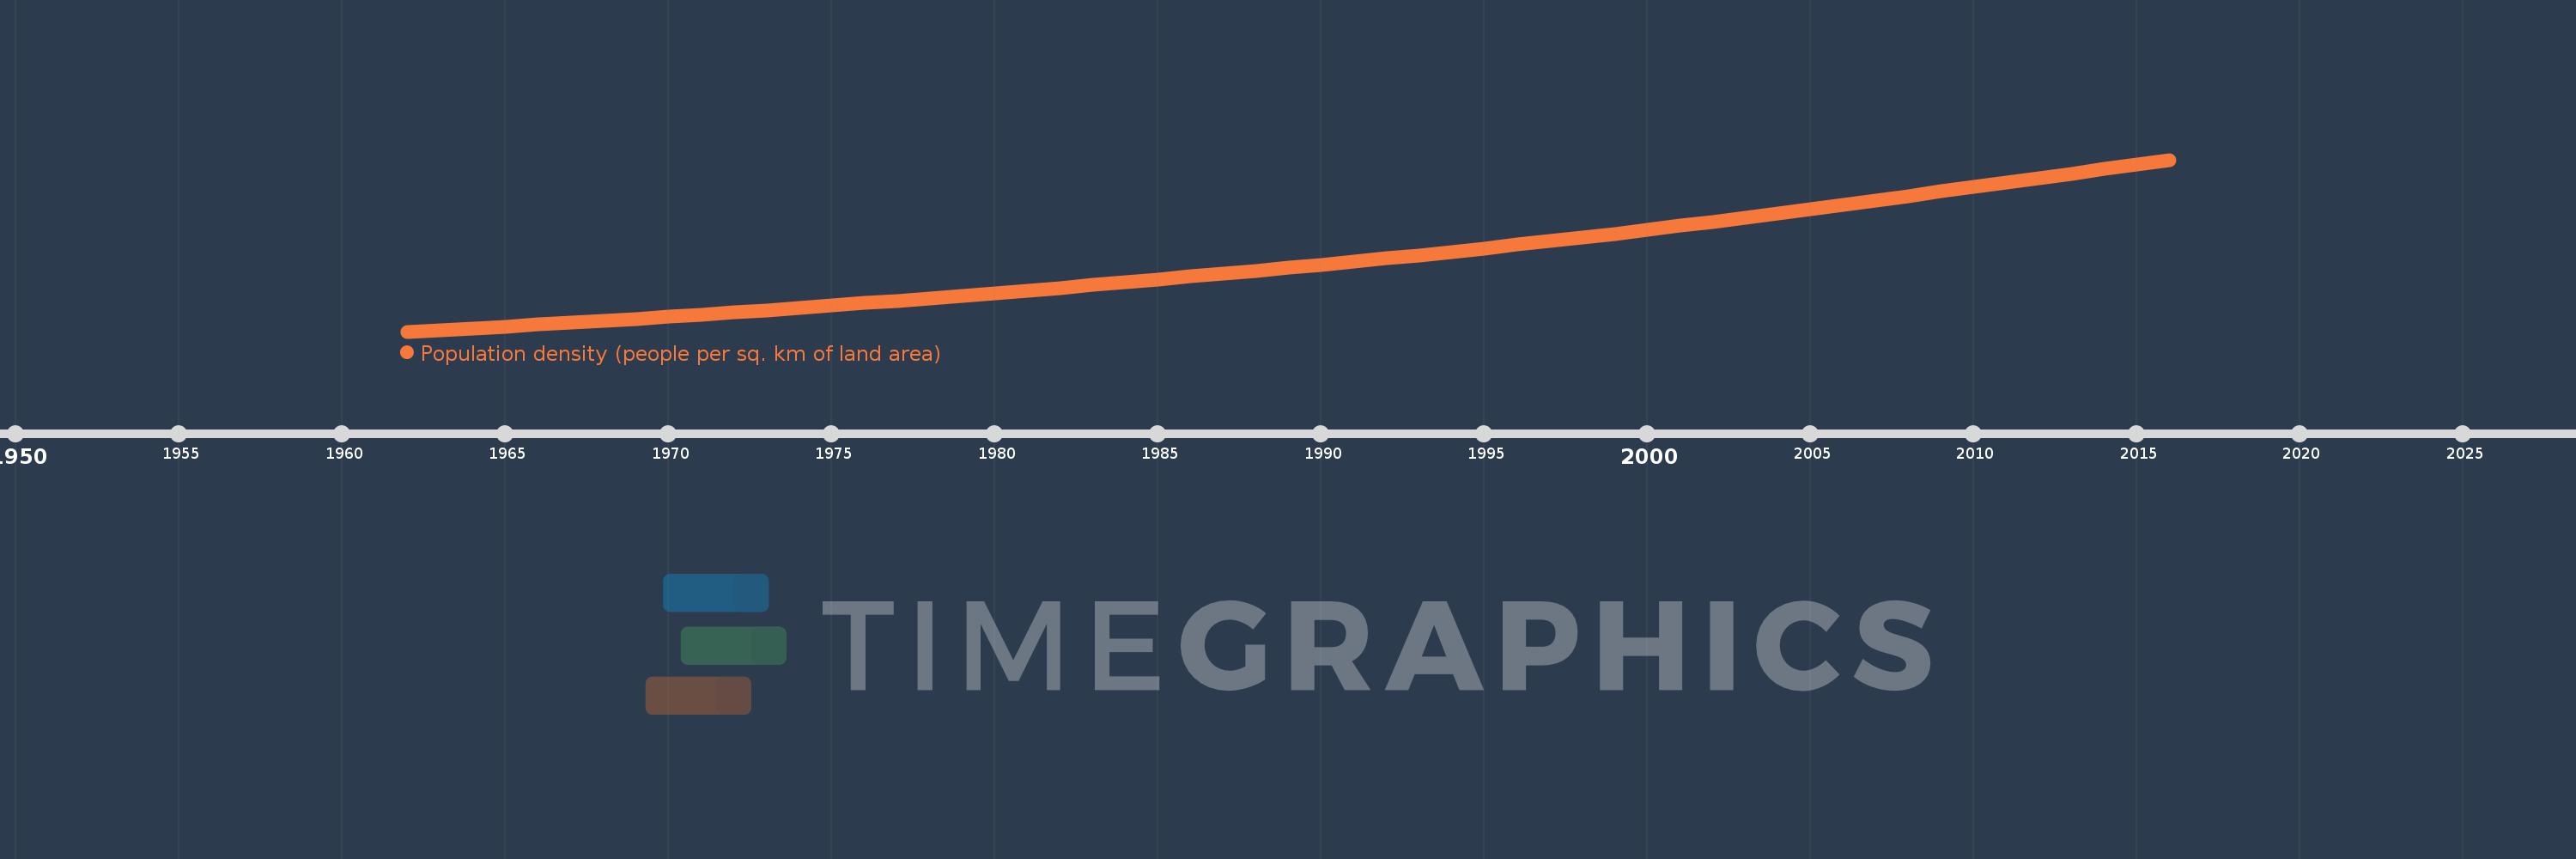
Population density (people per sq. km of land area)
2016,2015,2014,2013,2012,2011,2010,2009,2008,2007,2006,2005,2004,2003,2002,2001,2000,1999,1998,1997,1996,1995,1994,1993,1992,1991,1990,1989,1988,1987,1986,1985,1984,1983,1982,1981,1980,1979,1978,1977,1976,1975,1974,1973,1972,1971,1970,1969,1968,1967,1966,1965,1964,1963,1962
Estas estatísticas em outros países:
AfghanistanAlbaniaAlgeriaAmerican SamoaAndorraAngolaAntigua and BarbudaArab WorldArgentinaArmeniaArubaAustraliaAustriaAzerbaijanBahamas, TheBahrainBangladeshBarbadosBelarusBelgiumBelizeBeninBermudaBhutanBoliviaBosnia and HerzegovinaBotswanaBrazilBritish Virgin IslandsBrunei DarussalamBulgariaBurkina FasoBurundiCabo VerdeCambodiaCameroonCanadaCaribbean small statesCayman IslandsCentral African RepublicCentral Europe and the BalticsChadChannel IslandsChileChinaColombiaComorosCongo, Dem. Rep.Congo, Rep.Costa RicaCote d'IvoireCroatiaCubaCuracaoCyprusCzech RepublicDenmarkDjiboutiDominicaDominican RepublicEarly-demographic dividendEast Asia & PacificEast Asia & Pacific (excluding high income)East Asia & Pacific (IDA & IBRD countries)EcuadorEgypt, Arab Rep.El SalvadorEquatorial GuineaEritreaEstoniaEthiopiaEuro areaEurope & Central AsiaEurope & Central Asia (excluding high income)Europe & Central Asia (IDA & IBRD countries)European UnionFaroe IslandsFijiFinlandFragile and conflict affected situationsFranceFrench PolynesiaGabonGambia, TheGeorgiaGermanyGhanaGibraltarGreeceGreenlandGrenadaGuamGuatemalaGuineaGuinea-BissauGuyanaHaitiHeavily indebted poor countries (HIPC)High incomeHondurasHong Kong SAR, ChinaHungaryIBRD onlyIcelandIDA & IBRD totalIDA blendIDA onlyIDA totalIndiaIndonesiaIran, Islamic Rep.IraqIrelandIsle of ManIsraelItalyJamaicaJapanJordanKazakhstanKenyaKiribatiKorea, Dem. People’s Rep.Korea, Rep.KosovoKuwaitKyrgyz RepublicLao PDRLate-demographic dividendLatin America & Caribbean Latin America & Caribbean (excluding high income)Latin America & the Caribbean (IDA & IBRD countries)LatviaLeast developed countries: UN classificationLebanonLesothoLiberiaLibyaLiechtensteinLithuaniaLow & middle incomeLow incomeLower middle incomeLuxembourgMacao SAR, ChinaMacedonia, FYRMadagascarMalawiMalaysiaMaldivesMaliMaltaMarshall IslandsMauritaniaMauritiusMexicoMicronesia, Fed. Sts.Middle East & North AfricaMiddle East & North Africa (excluding high income)Middle East & North Africa (IDA & IBRD countries)Middle incomeMoldovaMonacoMongoliaMontenegroMoroccoMozambiqueMyanmarNamibiaNauruNepalNetherlandsNew CaledoniaNew ZealandNicaraguaNigerNigeriaNorth AmericaNorthern Mariana IslandsNorwayOECD membersOmanOther small statesPacific island small statesPakistanPalauPanamaPapua New GuineaParaguayPeruPhilippinesPolandPortugalPost-demographic dividendPre-demographic dividendPuerto RicoQatarRomaniaRussian FederationRwandaSamoaSan MarinoSao Tome and PrincipeSaudi ArabiaSenegalSerbiaSeychellesSierra LeoneSingaporeSint Maarten (Dutch part)Slovak RepublicSloveniaSmall statesSolomon IslandsSomaliaSouth AfricaSouth AsiaSouth Asia (IDA & IBRD)SpainSri LankaSt. Kitts and NevisSt. LuciaSt. Martin (French part)St. Vincent and the GrenadinesSub-Saharan Africa Sub-Saharan Africa (excluding high income)Sub-Saharan Africa (IDA & IBRD countries)SudanSurinameSwazilandSwedenSwitzerlandSyrian Arab RepublicTajikistanTanzaniaThailandTimor-LesteTogoTongaTrinidad and TobagoTunisiaTurkeyTurkmenistanTurks and Caicos IslandsTuvaluUgandaUkraineUnited Arab EmiratesUnited KingdomUnited StatesUpper middle incomeUruguayUzbekistanVanuatuVenezuela, RBVietnamVirgin Islands (U.S.)West Bank and GazaWorldYemen, Rep.ZambiaZimbabwe Linha do tempo:
Nesta escala de tempo está apresentado um gráfico de 1962 ano até 2016 ano Guatemala. Dados de 1961 ano ausente. O número de observações reais por data: 55.
Fonte (nome):
Indicadores de desenvolvimento mundial
Fonte (organização):
Food and Agriculture Organization and World Bank population estimates.
Categorias:
Urban Development
Foi atualizado:
23 abr 2017 ano
Indicadores de alterações dos valores ao longo dos anos
Mínimo:
39.568
1 jan 1962 ano
Máximo:
152.509
1 jan 2016 ano
Na data de observação
Valor
Mudança absoluta
A alteração em relação ao valor anterior
1 jan 1962 ano
39.568
+39.568
0.0%
1 jan 1963 ano
40.655
+1.087
2.75%
1 jan 1964 ano
41.778
+1.123
2.76%
1 jan 1965 ano
42.934
+1.156
2.77%
1 jan 1966 ano
44.123
+1.188
2.77%
1 jan 1967 ano
45.342
+1.219
2.76%
1 jan 1968 ano
46.595
+1.253
2.76%
1 jan 1969 ano
47.886
+1.291
2.77%
1 jan 1970 ano
49.223
+1.337
2.79%
1 jan 1971 ano
50.61
+1.387
2.82%
1 jan 1972 ano
52.051
+1.441
2.85%
1 jan 1973 ano
53.543
+1.492
2.87%
1 jan 1974 ano
55.076
+1.533
2.86%
1 jan 1975 ano
56.636
+1.559
2.83%
1 jan 1976 ano
58.212
+1.576
2.78%
1 jan 1977 ano
59.799
+1.587
2.73%
1 jan 1978 ano
61.401
+1.602
2.68%
1 jan 1979 ano
63.03
+1.629
2.65%
1 jan 1980 ano
64.702
+1.673
2.65%
1 jan 1981 ano
66.43
+1.728
2.67%
1 jan 1982 ano
68.219
+1.79
2.69%
1 jan 1983 ano
70.065
+1.846
2.71%
1 jan 1984 ano
71.95
+1.885
2.69%
1 jan 1985 ano
73.85
+1.901
2.64%
1 jan 1986 ano
75.751
+1.901
2.57%
1 jan 1987 ano
77.646
+1.894
2.5%
1 jan 1988 ano
79.543
+1.897
2.44%
1 jan 1989 ano
81.461
+1.919
2.41%
1 jan 1990 ano
83.429
+1.968
2.42%
1 jan 1991 ano
85.466
+2.037
2.44%
1 jan 1992 ano
87.579
+2.113
2.47%
1 jan 1993 ano
89.764
+2.185
2.49%
1 jan 1994 ano
92.013
+2.249
2.5%
1 jan 1995 ano
94.312
+2.299
2.5%
1 jan 1996 ano
96.653
+2.341
2.48%
1 jan 1997 ano
99.032
+2.379
2.46%
1 jan 1998 ano
101.454
+2.421
2.45%
1 jan 1999 ano
103.927
+2.473
2.44%
1 jan 2000 ano
106.465
+2.538
2.44%
1 jan 2001 ano
109.077
+2.611
2.45%
1 jan 2002 ano
111.765
+2.688
2.46%
1 jan 2003 ano
114.522
+2.757
2.47%
1 jan 2004 ano
117.332
+2.81
2.45%
1 jan 2005 ano
120.173
+2.84
2.42%
1 jan 2006 ano
123.026
+2.854
2.37%
1 jan 2007 ano
125.887
+2.861
2.33%
1 jan 2008 ano
128.757
+2.87
2.28%
1 jan 2009 ano
131.641
+2.884
2.24%
1 jan 2010 ano
134.547
+2.905
2.21%
1 jan 2011 ano
137.479
+2.932
2.18%
1 jan 2012 ano
140.437
+2.958
2.15%
1 jan 2013 ano
143.419
+2.981
2.12%
1 jan 2014 ano
146.424
+3.005
2.1%
1 jan 2015 ano
149.454
+3.03
2.07%
1 jan 2016 ano
152.509
+3.055
2.04%
Classificação de países por estatísticas atuais por anos


Comentários: