29
/pt/
pt
AIzaSyAYiBZKx7MnpbEhh9jyipgxe19OcubqV5w
April 1, 2024
39375
IDA only
IDX
false
2
1
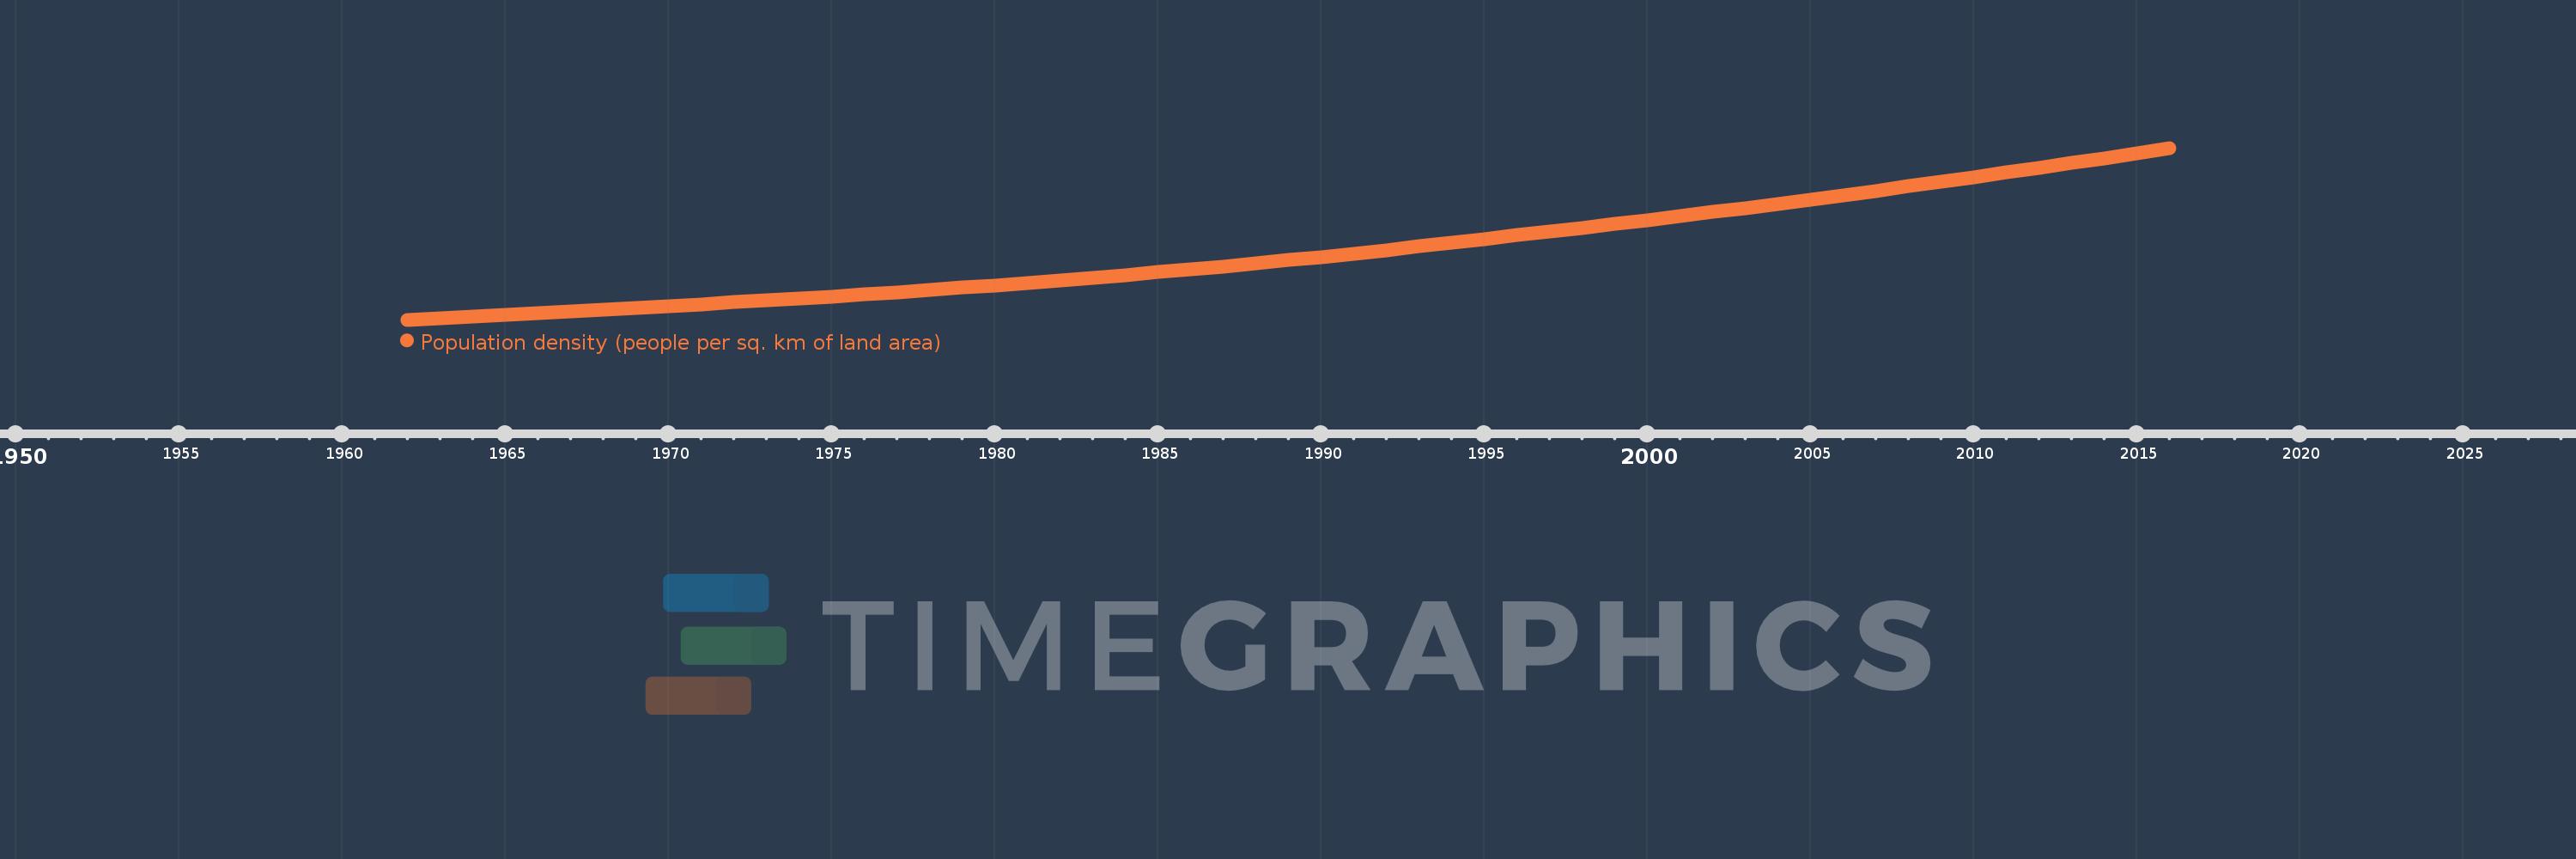
Population density (people per sq. km of land area)
2016,2015,2014,2013,2012,2011,2010,2009,2008,2007,2006,2005,2004,2003,2002,2001,2000,1999,1998,1997,1996,1995,1994,1993,1992,1991,1990,1989,1988,1987,1986,1985,1984,1983,1982,1981,1980,1979,1978,1977,1976,1975,1974,1973,1972,1971,1970,1969,1968,1967,1966,1965,1964,1963,1962
Estas estatísticas em outros países:
AfghanistanAlbaniaAlgeriaAmerican SamoaAndorraAngolaAntigua and BarbudaArab WorldArgentinaArmeniaArubaAustraliaAustriaAzerbaijanBahamas, TheBahrainBangladeshBarbadosBelarusBelgiumBelizeBeninBermudaBhutanBoliviaBosnia and HerzegovinaBotswanaBrazilBritish Virgin IslandsBrunei DarussalamBulgariaBurkina FasoBurundiCabo VerdeCambodiaCameroonCanadaCaribbean small statesCayman IslandsCentral African RepublicCentral Europe and the BalticsChadChannel IslandsChileChinaColombiaComorosCongo, Dem. Rep.Congo, Rep.Costa RicaCote d'IvoireCroatiaCubaCuracaoCyprusCzech RepublicDenmarkDjiboutiDominicaDominican RepublicEarly-demographic dividendEast Asia & PacificEast Asia & Pacific (excluding high income)East Asia & Pacific (IDA & IBRD countries)EcuadorEgypt, Arab Rep.El SalvadorEquatorial GuineaEritreaEstoniaEthiopiaEuro areaEurope & Central AsiaEurope & Central Asia (excluding high income)Europe & Central Asia (IDA & IBRD countries)European UnionFaroe IslandsFijiFinlandFragile and conflict affected situationsFranceFrench PolynesiaGabonGambia, TheGeorgiaGermanyGhanaGibraltarGreeceGreenlandGrenadaGuamGuatemalaGuineaGuinea-BissauGuyanaHaitiHeavily indebted poor countries (HIPC)High incomeHondurasHong Kong SAR, ChinaHungaryIBRD onlyIcelandIDA & IBRD totalIDA blendIDA onlyIDA totalIndiaIndonesiaIran, Islamic Rep.IraqIrelandIsle of ManIsraelItalyJamaicaJapanJordanKazakhstanKenyaKiribatiKorea, Dem. People’s Rep.Korea, Rep.KosovoKuwaitKyrgyz RepublicLao PDRLate-demographic dividendLatin America & Caribbean Latin America & Caribbean (excluding high income)Latin America & the Caribbean (IDA & IBRD countries)LatviaLeast developed countries: UN classificationLebanonLesothoLiberiaLibyaLiechtensteinLithuaniaLow & middle incomeLow incomeLower middle incomeLuxembourgMacao SAR, ChinaMacedonia, FYRMadagascarMalawiMalaysiaMaldivesMaliMaltaMarshall IslandsMauritaniaMauritiusMexicoMicronesia, Fed. Sts.Middle East & North AfricaMiddle East & North Africa (excluding high income)Middle East & North Africa (IDA & IBRD countries)Middle incomeMoldovaMonacoMongoliaMontenegroMoroccoMozambiqueMyanmarNamibiaNauruNepalNetherlandsNew CaledoniaNew ZealandNicaraguaNigerNigeriaNorth AmericaNorthern Mariana IslandsNorwayOECD membersOmanOther small statesPacific island small statesPakistanPalauPanamaPapua New GuineaParaguayPeruPhilippinesPolandPortugalPost-demographic dividendPre-demographic dividendPuerto RicoQatarRomaniaRussian FederationRwandaSamoaSan MarinoSao Tome and PrincipeSaudi ArabiaSenegalSerbiaSeychellesSierra LeoneSingaporeSint Maarten (Dutch part)Slovak RepublicSloveniaSmall statesSolomon IslandsSomaliaSouth AfricaSouth AsiaSouth Asia (IDA & IBRD)SpainSri LankaSt. Kitts and NevisSt. LuciaSt. Martin (French part)St. Vincent and the GrenadinesSub-Saharan Africa Sub-Saharan Africa (excluding high income)Sub-Saharan Africa (IDA & IBRD countries)SudanSurinameSwazilandSwedenSwitzerlandSyrian Arab RepublicTajikistanTanzaniaThailandTimor-LesteTogoTongaTrinidad and TobagoTunisiaTurkeyTurkmenistanTurks and Caicos IslandsTuvaluUgandaUkraineUnited Arab EmiratesUnited KingdomUnited StatesUpper middle incomeUruguayUzbekistanVanuatuVenezuela, RBVietnamVirgin Islands (U.S.)West Bank and GazaWorldYemen, Rep.ZambiaZimbabwe Linha do tempo:
Nesta escala de tempo está apresentado um gráfico de 1962 ano até 2016 ano IDA only. Dados de 1961 ano ausente. O número de observações reais por data: 55.
Fonte (nome):
Indicadores de desenvolvimento mundial
Fonte (organização):
Food and Agriculture Organization and World Bank population estimates.
Categorias:
Urban Development
Foi atualizado:
23 abr 2017 ano
Indicadores de alterações dos valores ao longo dos anos
Mínimo:
13.089
1 jan 1962 ano
Máximo:
51.253
1 jan 2016 ano
Na data de observação
Valor
Mudança absoluta
A alteração em relação ao valor anterior
1 jan 1962 ano
13.089
+13.089
0.0%
1 jan 1963 ano
13.417
+0.328
2.5%
1 jan 1964 ano
13.757
+0.34
2.54%
1 jan 1965 ano
14.112
+0.355
2.58%
1 jan 1966 ano
14.483
+0.371
2.63%
1 jan 1967 ano
14.871
+0.388
2.68%
1 jan 1968 ano
15.274
+0.403
2.71%
1 jan 1969 ano
15.689
+0.415
2.72%
1 jan 1970 ano
16.109
+0.42
2.68%
1 jan 1971 ano
16.53
+0.421
2.61%
1 jan 1972 ano
16.95
+0.421
2.54%
1 jan 1973 ano
17.373
+0.423
2.49%
1 jan 1974 ano
17.802
+0.429
2.47%
1 jan 1975 ano
18.244
+0.442
2.48%
1 jan 1976 ano
18.703
+0.459
2.52%
1 jan 1977 ano
19.18
+0.478
2.55%
1 jan 1978 ano
19.676
+0.496
2.58%
1 jan 1979 ano
20.189
+0.513
2.61%
1 jan 1980 ano
20.719
+0.53
2.62%
1 jan 1981 ano
21.265
+0.546
2.63%
1 jan 1982 ano
21.827
+0.562
2.64%
1 jan 1983 ano
22.406
+0.58
2.66%
1 jan 1984 ano
23.005
+0.598
2.67%
1 jan 1985 ano
23.623
+0.618
2.69%
1 jan 1986 ano
24.263
+0.639
2.71%
1 jan 1987 ano
24.923
+0.66
2.72%
1 jan 1988 ano
25.604
+0.681
2.73%
1 jan 1989 ano
26.307
+0.703
2.75%
1 jan 1990 ano
27.036
+0.729
2.77%
1 jan 1991 ano
27.79
+0.754
2.79%
1 jan 1992 ano
28.569
+0.779
2.8%
1 jan 1993 ano
29.373
+0.804
2.82%
1 jan 1994 ano
30.193
+0.82
2.79%
1 jan 1995 ano
31.032
+0.839
2.78%
1 jan 1996 ano
31.866
+0.834
2.69%
1 jan 1997 ano
32.701
+0.835
2.62%
1 jan 1998 ano
33.537
+0.836
2.56%
1 jan 1999 ano
34.374
+0.836
2.49%
1 jan 2000 ano
35.22
+0.846
2.46%
1 jan 2001 ano
36.091
+0.871
2.47%
1 jan 2002 ano
36.986
+0.895
2.48%
1 jan 2003 ano
37.9
+0.914
2.47%
1 jan 2004 ano
38.833
+0.933
2.46%
1 jan 2005 ano
39.785
+0.952
2.45%
1 jan 2006 ano
40.748
+0.963
2.42%
1 jan 2007 ano
41.726
+0.978
2.4%
1 jan 2008 ano
42.72
+0.994
2.38%
1 jan 2009 ano
43.729
+1.01
2.36%
1 jan 2010 ano
44.753
+1.023
2.34%
1 jan 2011 ano
45.789
+1.036
2.32%
1 jan 2012 ano
46.839
+1.05
2.29%
1 jan 2013 ano
47.905
+1.067
2.28%
1 jan 2014 ano
48.993
+1.087
2.27%
1 jan 2015 ano
50.109
+1.116
2.28%
1 jan 2016 ano
51.253
+1.145
2.28%
Classificação de países por estatísticas atuais por anos


Comentários: