29
/pt/
pt
AIzaSyAYiBZKx7MnpbEhh9jyipgxe19OcubqV5w
April 1, 2024
125313
Egypt, Arab Rep.
EGY
true
2
1
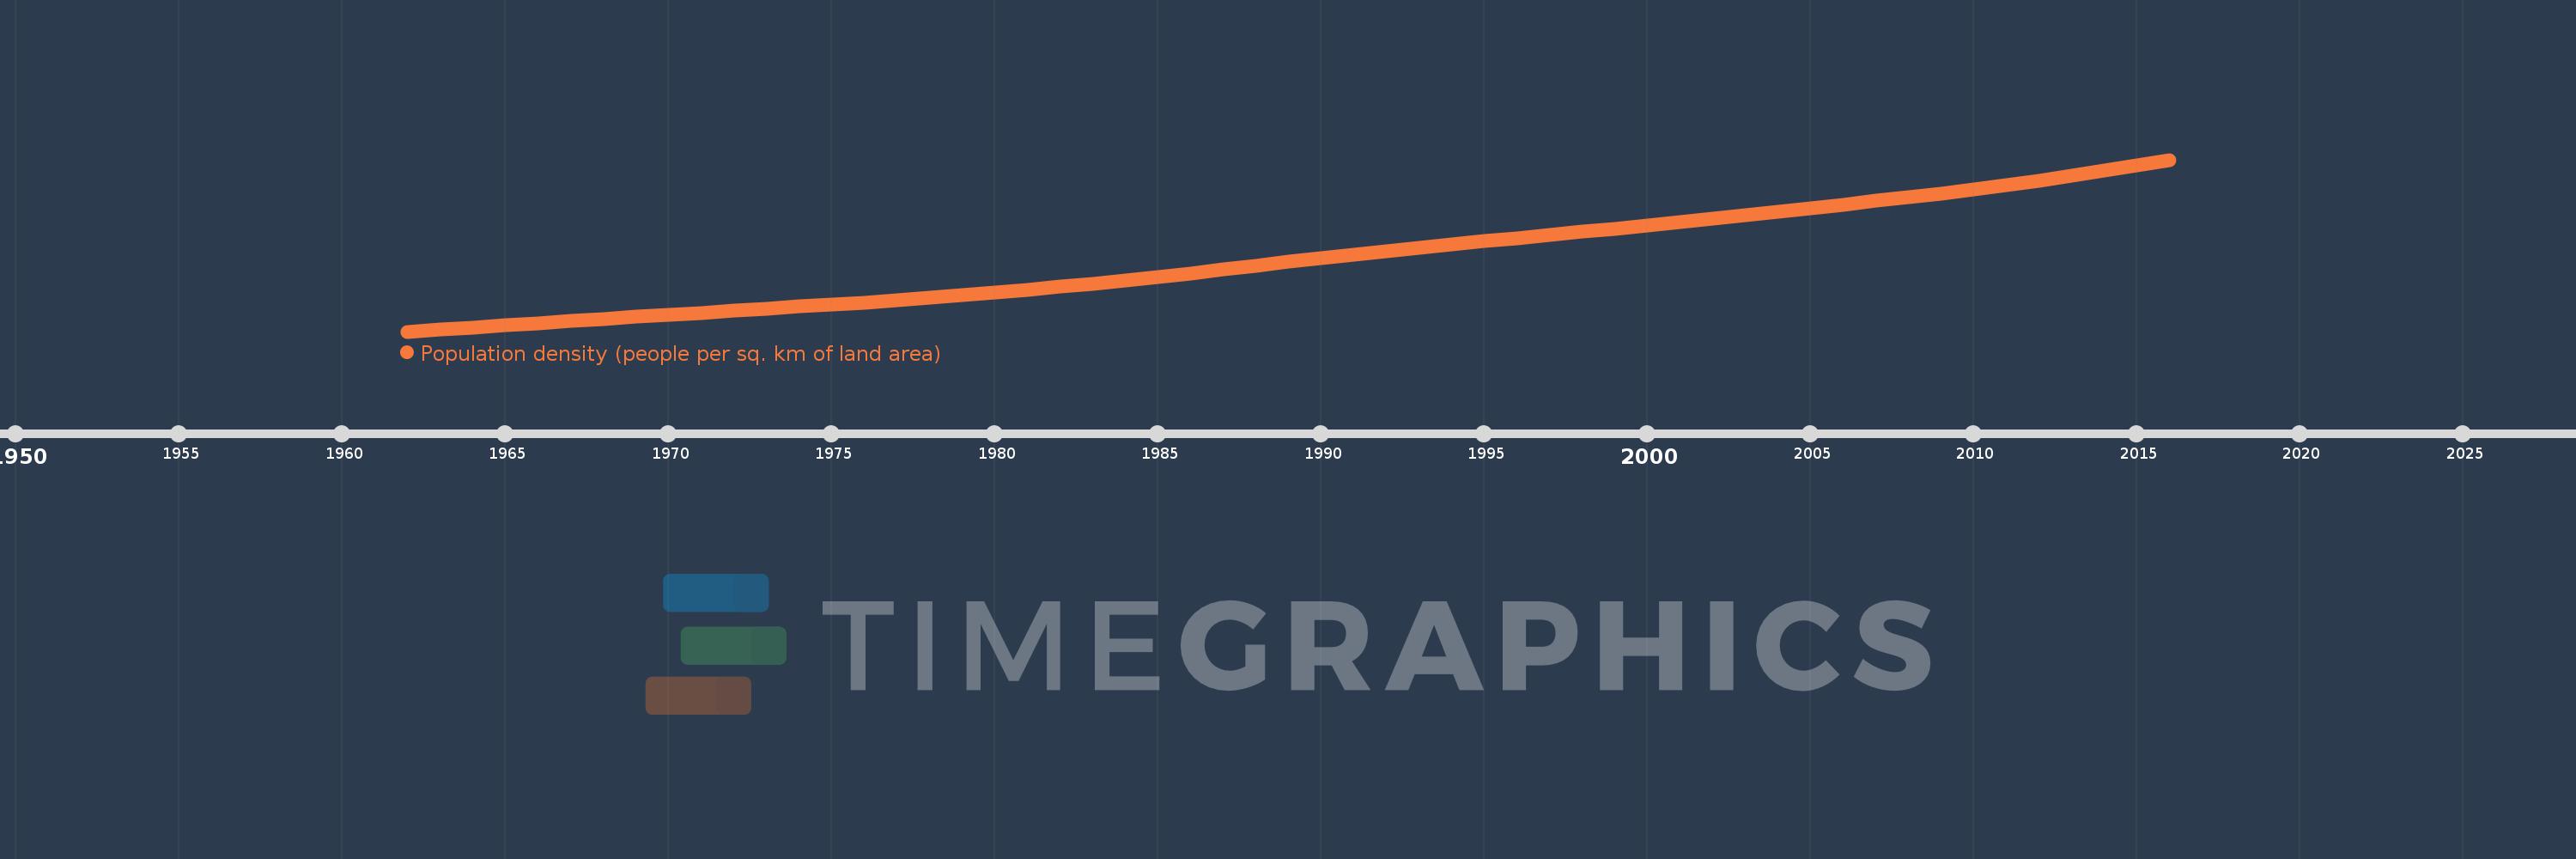
Population density (people per sq. km of land area)
2016,2015,2014,2013,2012,2011,2010,2009,2008,2007,2006,2005,2004,2003,2002,2001,2000,1999,1998,1997,1996,1995,1994,1993,1992,1991,1990,1989,1988,1987,1986,1985,1984,1983,1982,1981,1980,1979,1978,1977,1976,1975,1974,1973,1972,1971,1970,1969,1968,1967,1966,1965,1964,1963,1962
Estas estatísticas em outros países:
AfghanistanAlbaniaAlgeriaAmerican SamoaAndorraAngolaAntigua and BarbudaArab WorldArgentinaArmeniaArubaAustraliaAustriaAzerbaijanBahamas, TheBahrainBangladeshBarbadosBelarusBelgiumBelizeBeninBermudaBhutanBoliviaBosnia and HerzegovinaBotswanaBrazilBritish Virgin IslandsBrunei DarussalamBulgariaBurkina FasoBurundiCabo VerdeCambodiaCameroonCanadaCaribbean small statesCayman IslandsCentral African RepublicCentral Europe and the BalticsChadChannel IslandsChileChinaColombiaComorosCongo, Dem. Rep.Congo, Rep.Costa RicaCote d'IvoireCroatiaCubaCuracaoCyprusCzech RepublicDenmarkDjiboutiDominicaDominican RepublicEarly-demographic dividendEast Asia & PacificEast Asia & Pacific (excluding high income)East Asia & Pacific (IDA & IBRD countries)EcuadorEgypt, Arab Rep.El SalvadorEquatorial GuineaEritreaEstoniaEthiopiaEuro areaEurope & Central AsiaEurope & Central Asia (excluding high income)Europe & Central Asia (IDA & IBRD countries)European UnionFaroe IslandsFijiFinlandFragile and conflict affected situationsFranceFrench PolynesiaGabonGambia, TheGeorgiaGermanyGhanaGibraltarGreeceGreenlandGrenadaGuamGuatemalaGuineaGuinea-BissauGuyanaHaitiHeavily indebted poor countries (HIPC)High incomeHondurasHong Kong SAR, ChinaHungaryIBRD onlyIcelandIDA & IBRD totalIDA blendIDA onlyIDA totalIndiaIndonesiaIran, Islamic Rep.IraqIrelandIsle of ManIsraelItalyJamaicaJapanJordanKazakhstanKenyaKiribatiKorea, Dem. People’s Rep.Korea, Rep.KosovoKuwaitKyrgyz RepublicLao PDRLate-demographic dividendLatin America & Caribbean Latin America & Caribbean (excluding high income)Latin America & the Caribbean (IDA & IBRD countries)LatviaLeast developed countries: UN classificationLebanonLesothoLiberiaLibyaLiechtensteinLithuaniaLow & middle incomeLow incomeLower middle incomeLuxembourgMacao SAR, ChinaMacedonia, FYRMadagascarMalawiMalaysiaMaldivesMaliMaltaMarshall IslandsMauritaniaMauritiusMexicoMicronesia, Fed. Sts.Middle East & North AfricaMiddle East & North Africa (excluding high income)Middle East & North Africa (IDA & IBRD countries)Middle incomeMoldovaMonacoMongoliaMontenegroMoroccoMozambiqueMyanmarNamibiaNauruNepalNetherlandsNew CaledoniaNew ZealandNicaraguaNigerNigeriaNorth AmericaNorthern Mariana IslandsNorwayOECD membersOmanOther small statesPacific island small statesPakistanPalauPanamaPapua New GuineaParaguayPeruPhilippinesPolandPortugalPost-demographic dividendPre-demographic dividendPuerto RicoQatarRomaniaRussian FederationRwandaSamoaSan MarinoSao Tome and PrincipeSaudi ArabiaSenegalSerbiaSeychellesSierra LeoneSingaporeSint Maarten (Dutch part)Slovak RepublicSloveniaSmall statesSolomon IslandsSomaliaSouth AfricaSouth AsiaSouth Asia (IDA & IBRD)SpainSri LankaSt. Kitts and NevisSt. LuciaSt. Martin (French part)St. Vincent and the GrenadinesSub-Saharan Africa Sub-Saharan Africa (excluding high income)Sub-Saharan Africa (IDA & IBRD countries)SudanSurinameSwazilandSwedenSwitzerlandSyrian Arab RepublicTajikistanTanzaniaThailandTimor-LesteTogoTongaTrinidad and TobagoTunisiaTurkeyTurkmenistanTurks and Caicos IslandsTuvaluUgandaUkraineUnited Arab EmiratesUnited KingdomUnited StatesUpper middle incomeUruguayUzbekistanVanuatuVenezuela, RBVietnamVirgin Islands (U.S.)West Bank and GazaWorldYemen, Rep.ZambiaZimbabwe Linha do tempo:
Nesta escala de tempo está apresentado um gráfico de 1962 ano até 2016 ano Egypt, Arab Rep.. Dados de 1961 ano ausente. O número de observações reais por data: 55.
Fonte (nome):
Indicadores de desenvolvimento mundial
Fonte (organização):
Food and Agriculture Organization and World Bank population estimates.
Categorias:
Urban Development
Foi atualizado:
23 abr 2017 ano
Indicadores de alterações dos valores ao longo dos anos
Mínimo:
27.937
1 jan 1962 ano
Máximo:
91.926
1 jan 2016 ano
Na data de observação
Valor
Mudança absoluta
A alteração em relação ao valor anterior
1 jan 1962 ano
27.937
+27.937
0.0%
1 jan 1963 ano
28.691
+0.754
2.7%
1 jan 1964 ano
29.457
+0.765
2.67%
1 jan 1965 ano
30.232
+0.775
2.63%
1 jan 1966 ano
31.014
+0.782
2.59%
1 jan 1967 ano
31.806
+0.792
2.55%
1 jan 1968 ano
32.605
+0.799
2.51%
1 jan 1969 ano
33.404
+0.799
2.45%
1 jan 1970 ano
34.194
+0.789
2.36%
1 jan 1971 ano
34.968
+0.774
2.26%
1 jan 1972 ano
35.724
+0.756
2.16%
1 jan 1973 ano
36.468
+0.744
2.08%
1 jan 1974 ano
37.216
+0.748
2.05%
1 jan 1975 ano
37.988
+0.772
2.08%
1 jan 1976 ano
38.801
+0.813
2.14%
1 jan 1977 ano
39.659
+0.858
2.21%
1 jan 1978 ano
40.562
+0.903
2.28%
1 jan 1979 ano
41.514
+0.951
2.35%
1 jan 1980 ano
42.515
+1.001
2.41%
1 jan 1981 ano
43.568
+1.053
2.48%
1 jan 1982 ano
44.669
+1.101
2.53%
1 jan 1983 ano
45.819
+1.15
2.57%
1 jan 1984 ano
47.021
+1.202
2.62%
1 jan 1985 ano
48.281
+1.26
2.68%
1 jan 1986 ano
49.599
+1.318
2.73%
1 jan 1987 ano
50.98
+1.381
2.78%
1 jan 1988 ano
52.412
+1.432
2.81%
1 jan 1989 ano
53.863
+1.45
2.77%
1 jan 1990 ano
55.287
+1.425
2.65%
1 jan 1991 ano
56.655
+1.368
2.47%
1 jan 1992 ano
57.954
+1.298
2.29%
1 jan 1993 ano
59.191
+1.238
2.14%
1 jan 1994 ano
60.383
+1.192
2.01%
1 jan 1995 ano
61.553
+1.17
1.94%
1 jan 1996 ano
62.72
+1.167
1.9%
1 jan 1997 ano
63.886
+1.166
1.86%
1 jan 1998 ano
65.051
+1.164
1.82%
1 jan 1999 ano
66.224
+1.173
1.8%
1 jan 2000 ano
67.42
+1.196
1.81%
1 jan 2001 ano
68.647
+1.228
1.82%
1 jan 2002 ano
69.918
+1.271
1.85%
1 jan 2003 ano
71.233
+1.315
1.88%
1 jan 2004 ano
72.578
+1.345
1.89%
1 jan 2005 ano
73.932
+1.355
1.87%
1 jan 2006 ano
75.285
+1.352
1.83%
1 jan 2007 ano
76.623
+1.338
1.78%
1 jan 2008 ano
77.96
+1.337
1.75%
1 jan 2009 ano
79.337
+1.377
1.77%
1 jan 2010 ano
80.81
+1.473
1.86%
1 jan 2011 ano
82.416
+1.606
1.99%
1 jan 2012 ano
84.171
+1.755
2.13%
1 jan 2013 ano
86.052
+1.882
2.24%
1 jan 2014 ano
88.014
+1.962
2.28%
1 jan 2015 ano
89.989
+1.975
2.24%
1 jan 2016 ano
91.926
+1.937
2.15%
Classificação de países por estatísticas atuais por anos


Comentários: