29
/pt/
pt
AIzaSyAYiBZKx7MnpbEhh9jyipgxe19OcubqV5w
April 1, 2024
62794
World
WLD
false
2
1
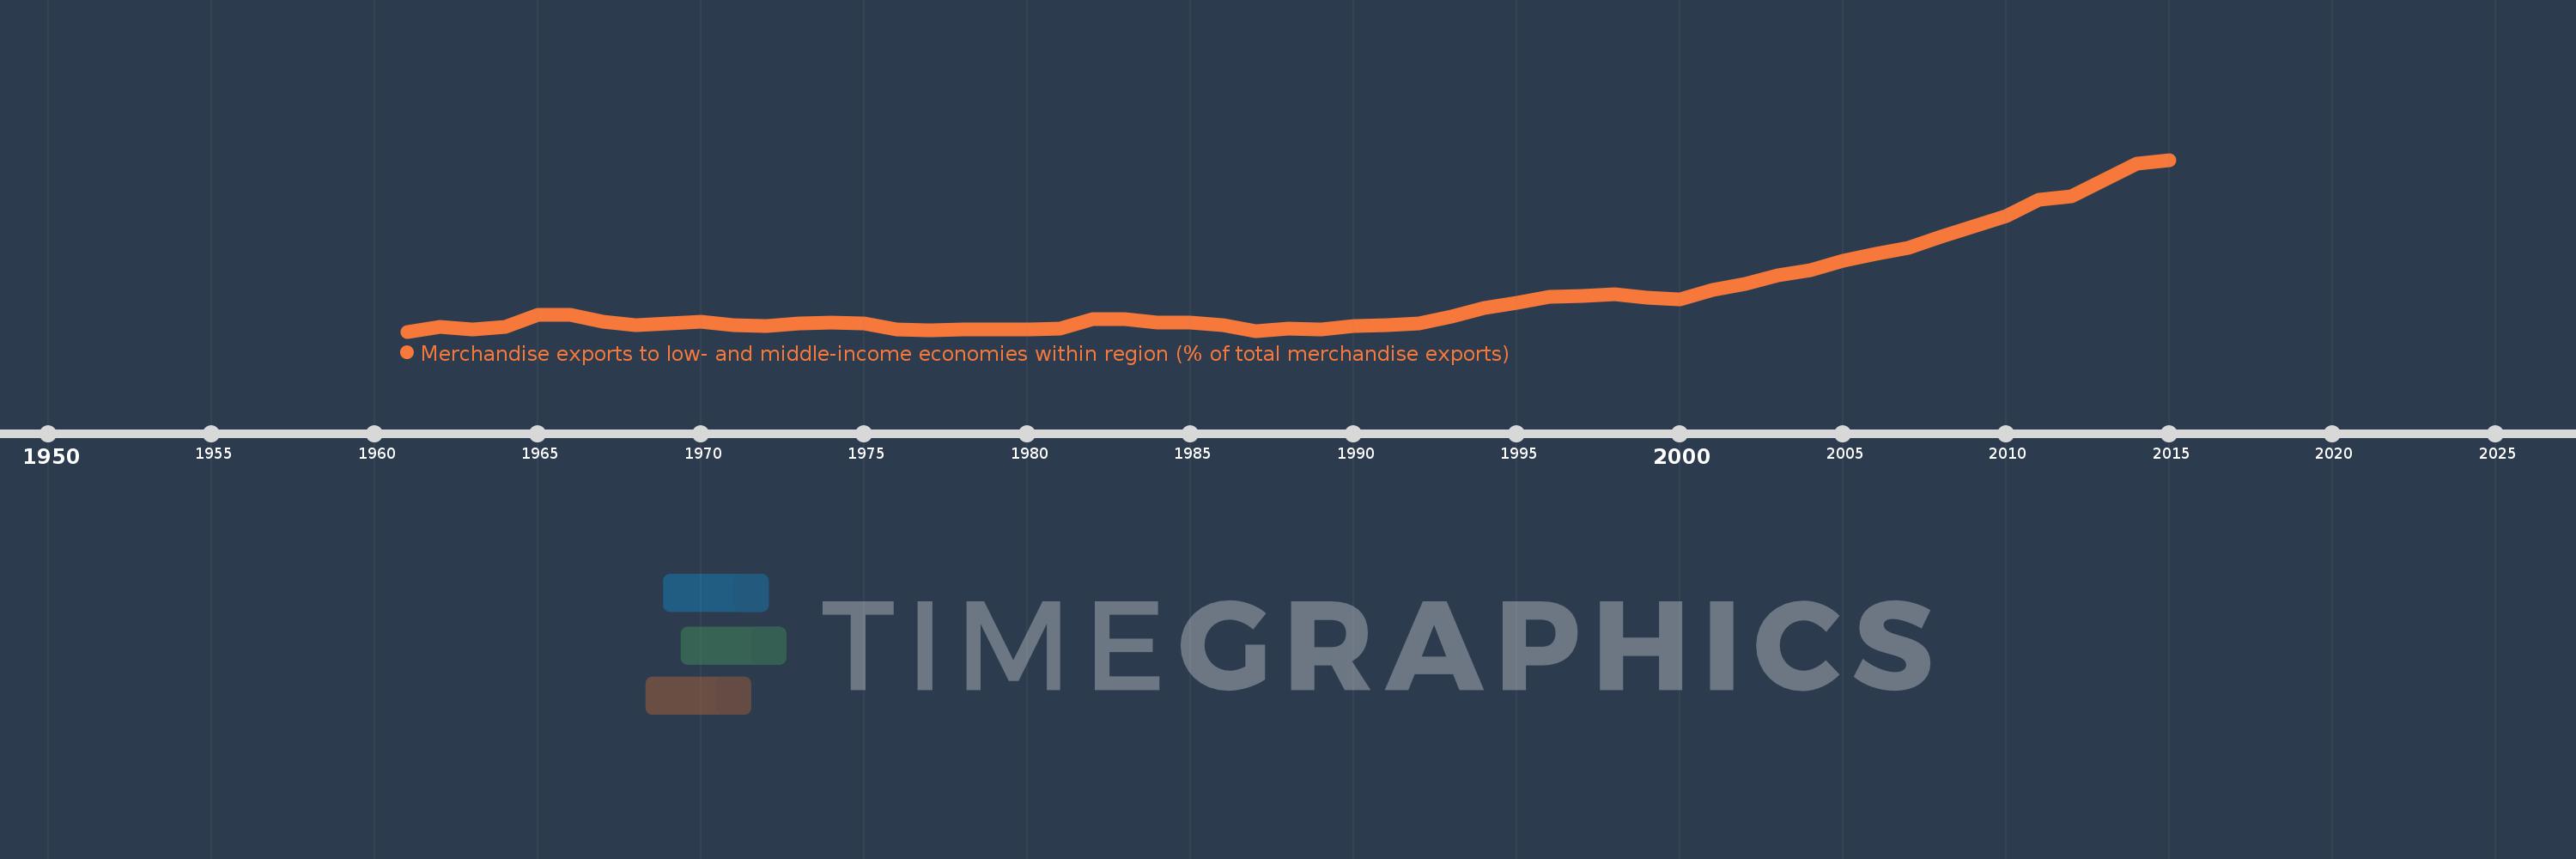
Merchandise exports to low- and middle-income economies within region (% of total merchandise exports)
2015,2014,2013,2012,2011,2010,2009,2008,2007,2006,2005,2004,2003,2002,2001,2000,1999,1998,1997,1996,1995,1994,1993,1992,1991,1990,1989,1988,1987,1986,1985,1984,1983,1982,1981,1980,1979,1978,1977,1976,1975,1974,1973,1972,1971,1970,1969,1968,1967,1966,1965,1964,1963,1962,1961
Estas estatísticas em outros países:
Linha do tempo:
Nesta escala de tempo está apresentado um gráfico de 1961 ano até 2015 ano World. Dados de 1960 ano ausente. O número de observações reais por data: 55.
Fonte (nome):
Indicadores de desenvolvimento mundial
Fonte (organização):
World Bank staff estimates based data from International Monetary Fund's Direction of Trade database.
Categorias:
Private Sector, Trade
Foi atualizado:
23 abr 2017 ano
Indicadores de alterações dos valores ao longo dos anos
Mínimo:
0.601
1 jan 1961 ano
Máximo:
4.126
1 jan 2015 ano
Na data de observação
Valor
Mudança absoluta
A alteração em relação ao valor anterior
1 jan 1961 ano
0.601
+0.601
0.0%
1 jan 1962 ano
0.699
+0.098
16.3%
1 jan 1963 ano
0.641
-0.059
-8.39%
1 jan 1964 ano
0.693
+0.053
8.22%
1 jan 1965 ano
0.948
+0.255
36.73%
1 jan 1966 ano
0.941
-0.007
-0.73%
1 jan 1967 ano
0.806
-0.135
-14.38%
1 jan 1968 ano
0.737
-0.068
-8.49%
1 jan 1969 ano
0.769
+0.031
4.24%
1 jan 1970 ano
0.8
+0.032
4.11%
1 jan 1971 ano
0.736
-0.065
-8.07%
1 jan 1972 ano
0.708
-0.028
-3.76%
1 jan 1973 ano
0.77
+0.062
8.7%
1 jan 1974 ano
0.781
+0.011
1.45%
1 jan 1975 ano
0.764
-0.017
-2.19%
1 jan 1976 ano
0.648
-0.116
-15.13%
1 jan 1977 ano
0.624
-0.025
-3.8%
1 jan 1978 ano
0.65
+0.027
4.32%
1 jan 1979 ano
0.648
-0.003
-0.43%
1 jan 1980 ano
0.641
-0.007
-1.02%
1 jan 1981 ano
0.663
+0.022
3.5%
1 jan 1982 ano
0.856
+0.193
29.09%
1 jan 1983 ano
0.856
-0.001
-0.09%
1 jan 1984 ano
0.787
-0.069
-8.01%
1 jan 1985 ano
0.784
-0.003
-0.37%
1 jan 1986 ano
0.731
-0.054
-6.84%
1 jan 1987 ano
0.607
-0.124
-16.97%
1 jan 1988 ano
0.657
+0.051
8.36%
1 jan 1989 ano
0.64
-0.017
-2.6%
1 jan 1990 ano
0.72
+0.08
12.48%
1 jan 1991 ano
0.734
+0.013
1.85%
1 jan 1992 ano
0.769
+0.035
4.84%
1 jan 1993 ano
0.917
+0.148
19.29%
1 jan 1994 ano
1.085
+0.167
18.24%
1 jan 1995 ano
1.19
+0.105
9.68%
1 jan 1996 ano
1.314
+0.124
10.43%
1 jan 1997 ano
1.341
+0.027
2.06%
1 jan 1998 ano
1.365
+0.024
1.78%
1 jan 1999 ano
1.292
-0.073
-5.36%
1 jan 2000 ano
1.268
-0.024
-1.83%
1 jan 2001 ano
1.45
+0.182
14.34%
1 jan 2002 ano
1.572
+0.122
8.45%
1 jan 2003 ano
1.751
+0.179
11.36%
1 jan 2004 ano
1.858
+0.107
6.11%
1 jan 2005 ano
2.054
+0.196
10.55%
1 jan 2006 ano
2.196
+0.142
6.91%
1 jan 2007 ano
2.315
+0.12
5.44%
1 jan 2008 ano
2.54
+0.224
9.69%
1 jan 2009 ano
2.767
+0.227
8.95%
1 jan 2010 ano
2.98
+0.213
7.71%
1 jan 2011 ano
3.299
+0.319
10.7%
1 jan 2012 ano
3.372
+0.073
2.21%
1 jan 2013 ano
3.718
+0.346
10.27%
1 jan 2014 ano
4.041
+0.323
8.68%
1 jan 2015 ano
4.126
+0.085
2.1%
Classificação de países por estatísticas atuais por anos


Comentários: