29
/pt/
pt
AIzaSyAYiBZKx7MnpbEhh9jyipgxe19OcubqV5w
April 1, 2024
145935
Guinea
GIN
true
2
1
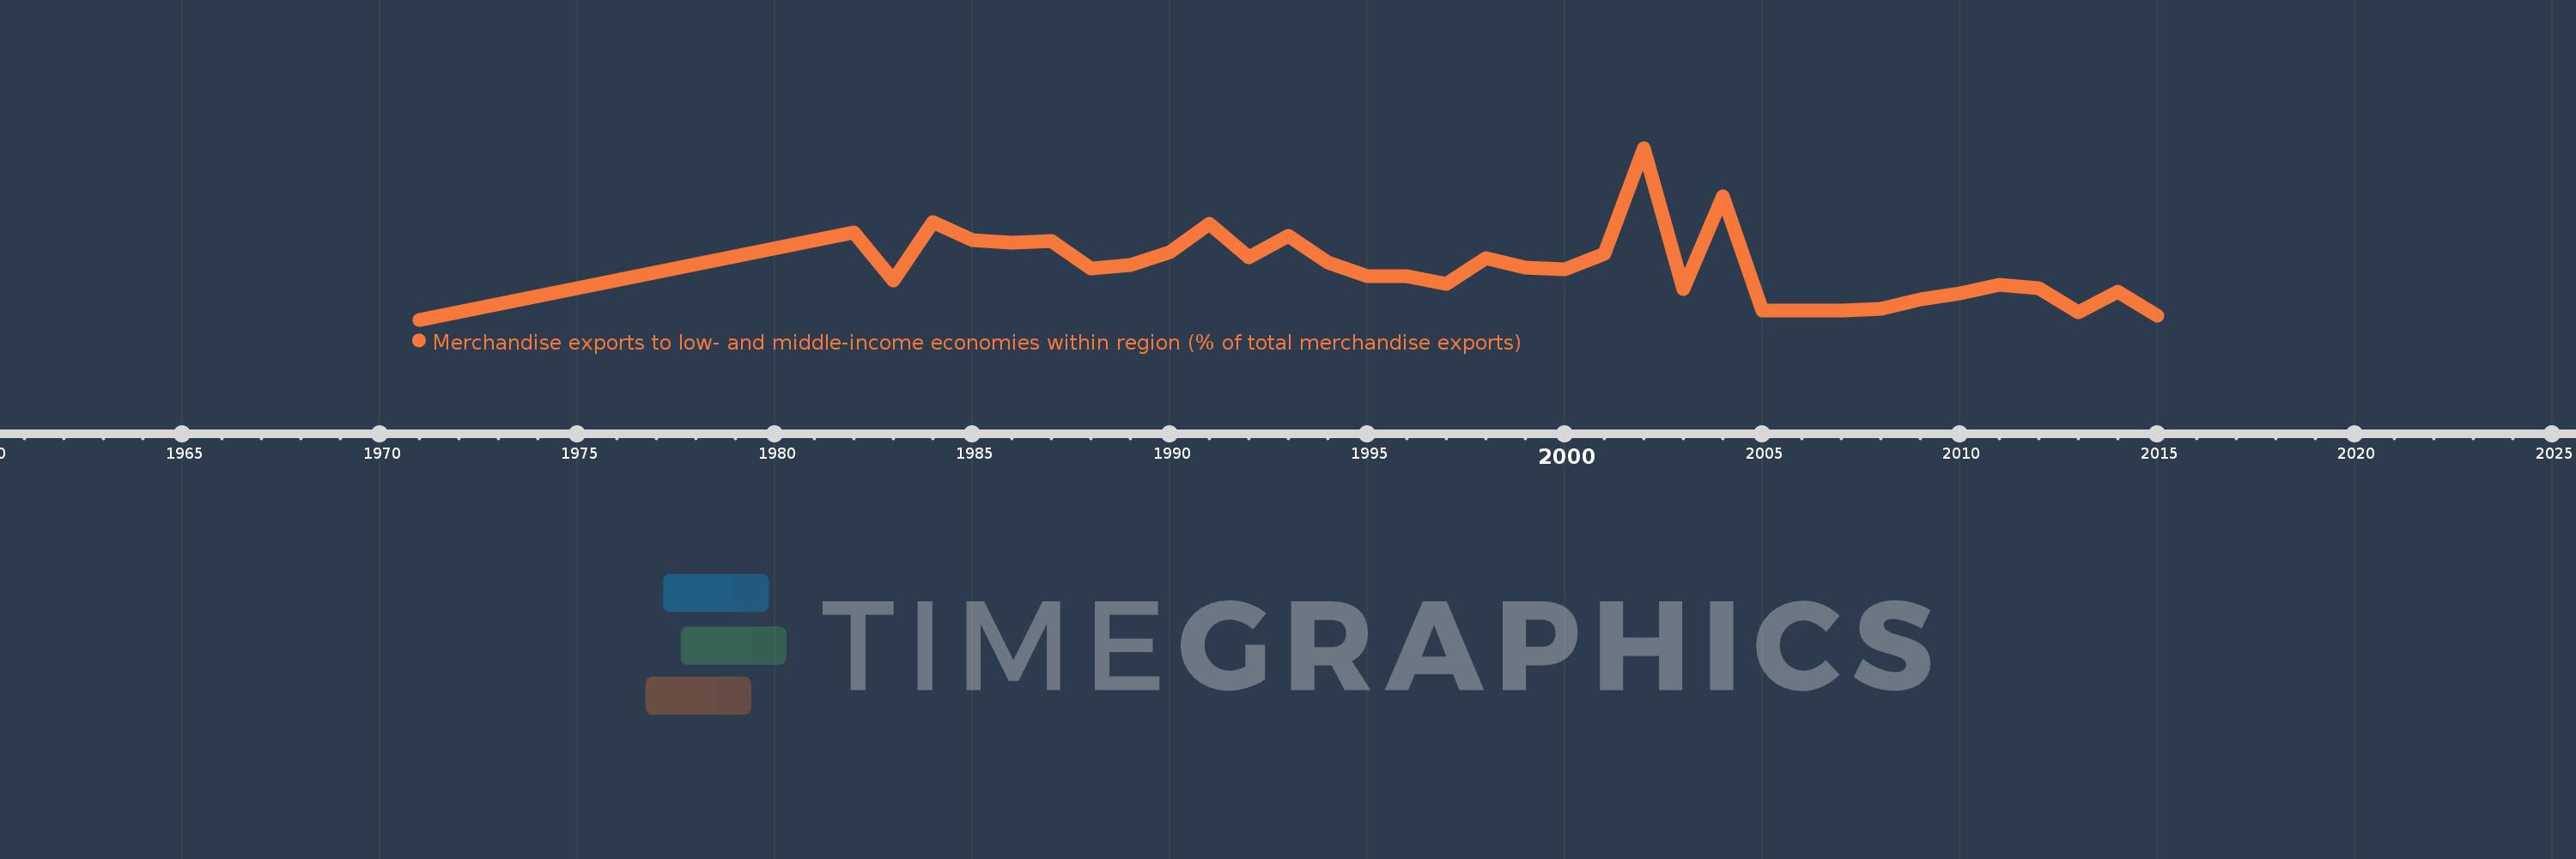
Merchandise exports to low- and middle-income economies within region (% of total merchandise exports)
2015,2014,2013,2012,2011,2010,2009,2008,2007,2006,2005,2004,2003,2002,2001,2000,1999,1998,1997,1996,1995,1994,1993,1992,1991,1990,1989,1988,1987,1986,1985,1984,1983,1982,1971
Estas estatísticas em outros países:
Linha do tempo:
Nesta escala de tempo está apresentado um gráfico de 1971 ano até 2015 ano Guinea. Dados de 1970 ano ausente. O número de observações reais por data: 35.
Fonte (nome):
Indicadores de desenvolvimento mundial
Fonte (organização):
World Bank staff estimates based data from International Monetary Fund's Direction of Trade database.
Categorias:
Private Sector, Trade
Foi atualizado:
23 abr 2017 ano
Indicadores de alterações dos valores ao longo dos anos
Mínimo:
0.644
1 jan 1971 ano
Máximo:
14.522
1 jan 2002 ano
Na data de observação
Valor
Mudança absoluta
A alteração em relação ao valor anterior
1 jan 1971 ano
0.644
+0.644
0.0%
1 jan 1982 ano
7.725
+7.081
1.1 mil%
1 jan 1983 ano
3.797
-3.928
-50.85%
1 jan 1984 ano
8.517
+4.721
124.34%
1 jan 1985 ano
7.046
-1.471
-17.28%
1 jan 1986 ano
6.842
-0.204
-2.89%
1 jan 1987 ano
7.034
+0.192
2.81%
1 jan 1988 ano
4.793
-2.241
-31.86%
1 jan 1989 ano
5.059
+0.266
5.54%
1 jan 1990 ano
6.082
+1.023
20.22%
1 jan 1991 ano
8.418
+2.337
38.42%
1 jan 1992 ano
5.679
-2.739
-32.54%
1 jan 1993 ano
7.425
+1.745
30.73%
1 jan 1994 ano
5.241
-2.183
-29.41%
1 jan 1995 ano
4.15
-1.091
-20.81%
1 jan 1996 ano
4.133
-0.017
-0.42%
1 jan 1997 ano
3.512
-0.622
-15.04%
1 jan 1998 ano
5.61
+2.098
59.76%
1 jan 1999 ano
4.85
-0.76
-13.55%
1 jan 2000 ano
4.736
-0.114
-2.34%
1 jan 2001 ano
5.956
+1.22
25.76%
1 jan 2002 ano
14.522
+8.566
143.83%
1 jan 2003 ano
3.14
-11.382
-78.38%
1 jan 2004 ano
10.602
+7.463
237.67%
1 jan 2005 ano
1.355
-9.248
-87.22%
1 jan 2006 ano
1.407
+0.052
3.85%
1 jan 2007 ano
1.377
-0.03
-2.11%
1 jan 2008 ano
1.524
+0.147
10.66%
1 jan 2009 ano
2.256
+0.732
48.04%
1 jan 2010 ano
2.764
+0.508
22.52%
1 jan 2011 ano
3.444
+0.68
24.6%
1 jan 2012 ano
3.22
-0.224
-6.51%
1 jan 2013 ano
1.221
-1.999
-62.08%
1 jan 2014 ano
2.896
+1.675
137.19%
1 jan 2015 ano
0.94
-1.956
-67.53%
Classificação de países por estatísticas atuais por anos


Comentários: