29
/pt/
pt
AIzaSyAYiBZKx7MnpbEhh9jyipgxe19OcubqV5w
April 1, 2024
244751
Somalia
SOM
true
2
1
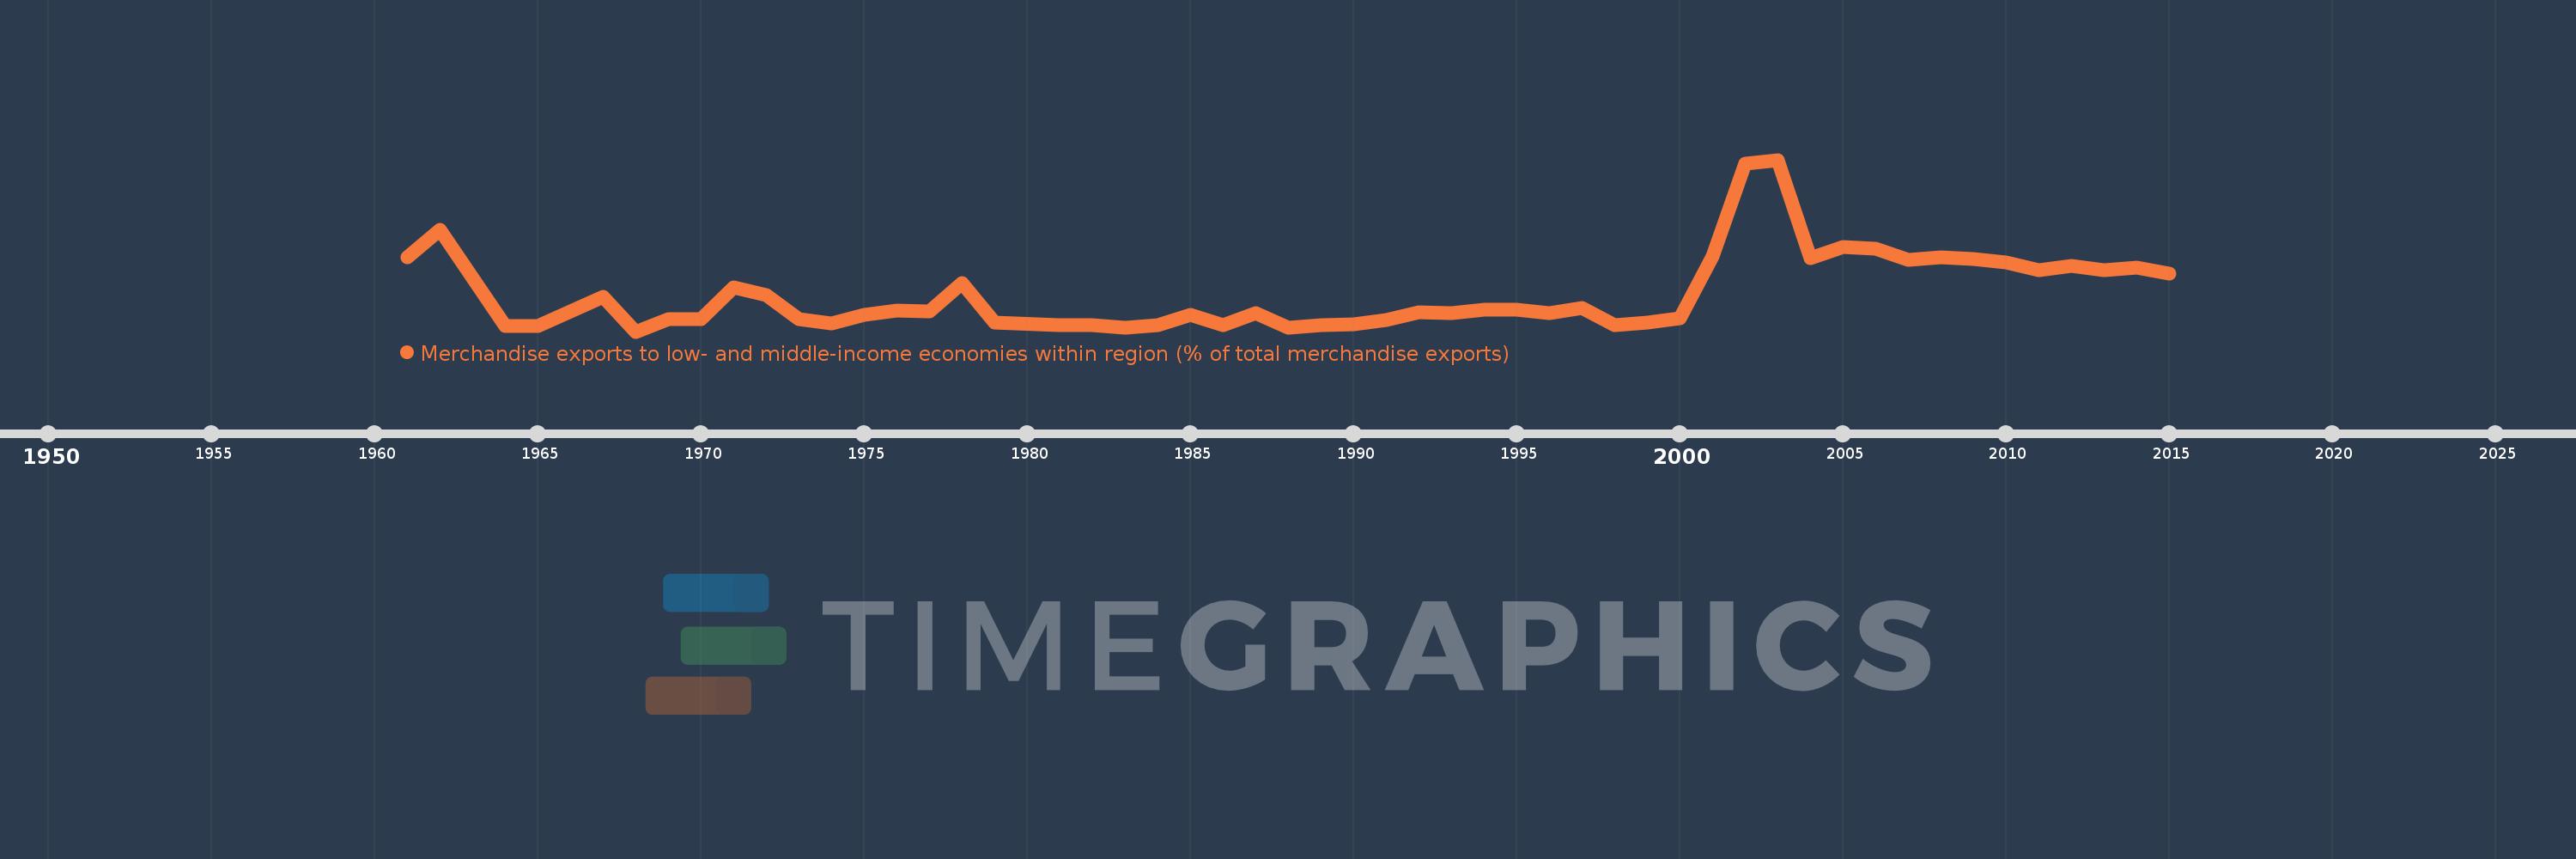
Merchandise exports to low- and middle-income economies within region (% of total merchandise exports)
2015,2014,2013,2012,2011,2010,2009,2008,2007,2006,2005,2004,2003,2002,2001,2000,1999,1998,1997,1996,1995,1994,1993,1992,1991,1990,1989,1988,1987,1986,1985,1984,1983,1982,1981,1979,1978,1977,1976,1975,1974,1973,1972,1971,1970,1969,1968,1967,1965,1964,1962,1961
Estas estatísticas em outros países:
Linha do tempo:
Nesta escala de tempo está apresentado um gráfico de 1961 ano até 2015 ano Somalia. Dados de 1960 ano ausente. O número de observações reais por data: 52.
Fonte (nome):
Indicadores de desenvolvimento mundial
Fonte (organização):
World Bank staff estimates based data from International Monetary Fund's Direction of Trade database.
Categorias:
Private Sector, Trade
Foi atualizado:
23 abr 2017 ano
Indicadores de alterações dos valores ao longo dos anos
Máximo:
9.018
1 jan 2003 ano
Na data de observação
Valor
Mudança absoluta
A alteração em relação ao valor anterior
1 jan 1961 ano
3.913
+3.913
0.0%
1 jan 1962 ano
5.323
+1.41
36.04%
1 jan 1964 ano
0.313
-5.011
-94.13%
1 jan 1965 ano
0.279
-0.034
-10.86%
1 jan 1967 ano
1.824
+1.545
554.71%
1 jan 1968 ano
0.0
-1.824
-100.0%
1 jan 1969 ano
0.667
+0.667
%
1 jan 1970 ano
0.65
-0.017
-2.59%
1 jan 1971 ano
2.329
+1.679
258.38%
1 jan 1972 ano
1.922
-0.407
-17.49%
1 jan 1973 ano
0.645
-1.277
-66.44%
1 jan 1974 ano
0.442
-0.203
-31.46%
1 jan 1975 ano
0.861
+0.419
94.72%
1 jan 1976 ano
1.121
+0.26
30.24%
1 jan 1977 ano
1.07
-0.051
-4.53%
1 jan 1978 ano
2.541
+1.47
137.39%
1 jan 1979 ano
0.456
-2.085
-82.05%
1 jan 1981 ano
0.335
-0.121
-26.58%
1 jan 1982 ano
0.335
+0.0
0.0%
1 jan 1983 ano
0.216
-0.119
-35.42%
1 jan 1984 ano
0.359
+0.143
66.01%
1 jan 1985 ano
0.89
+0.531
147.77%
1 jan 1986 ano
0.359
-0.531
-59.68%
1 jan 1987 ano
0.952
+0.593
165.33%
1 jan 1988 ano
0.222
-0.73
-76.69%
1 jan 1989 ano
0.356
+0.134
60.32%
1 jan 1990 ano
0.401
+0.045
12.75%
1 jan 1991 ano
0.596
+0.195
48.65%
1 jan 1992 ano
1.016
+0.42
70.52%
1 jan 1993 ano
0.985
-0.031
-3.08%
1 jan 1994 ano
1.144
+0.159
16.14%
1 jan 1995 ano
1.169
+0.025
2.17%
1 jan 1996 ano
0.972
-0.197
-16.82%
1 jan 1997 ano
1.224
+0.252
25.92%
1 jan 1998 ano
0.324
-0.9
-73.54%
1 jan 1999 ano
0.491
+0.167
51.61%
1 jan 2000 ano
0.681
+0.19
38.7%
1 jan 2001 ano
3.95
+3.268
479.82%
1 jan 2002 ano
8.831
+4.882
123.6%
1 jan 2003 ano
9.018
+0.187
2.12%
1 jan 2004 ano
3.856
-5.162
-57.24%
1 jan 2005 ano
4.421
+0.565
14.64%
1 jan 2006 ano
4.37
-0.051
-1.15%
1 jan 2007 ano
3.77
-0.601
-13.74%
1 jan 2008 ano
3.913
+0.143
3.8%
1 jan 2009 ano
3.815
-0.098
-2.5%
1 jan 2010 ano
3.647
-0.168
-4.4%
1 jan 2011 ano
3.204
-0.443
-12.16%
1 jan 2012 ano
3.431
+0.228
7.11%
1 jan 2013 ano
3.21
-0.221
-6.44%
1 jan 2014 ano
3.364
+0.153
4.78%
1 jan 2015 ano
3.034
-0.33
-9.8%
Classificação de países por estatísticas atuais por anos


Comentários: