29
/pt/
pt
AIzaSyAYiBZKx7MnpbEhh9jyipgxe19OcubqV5w
April 1, 2024
60164
Sub-Saharan Africa (excluding high income)
SSA
false
2
1
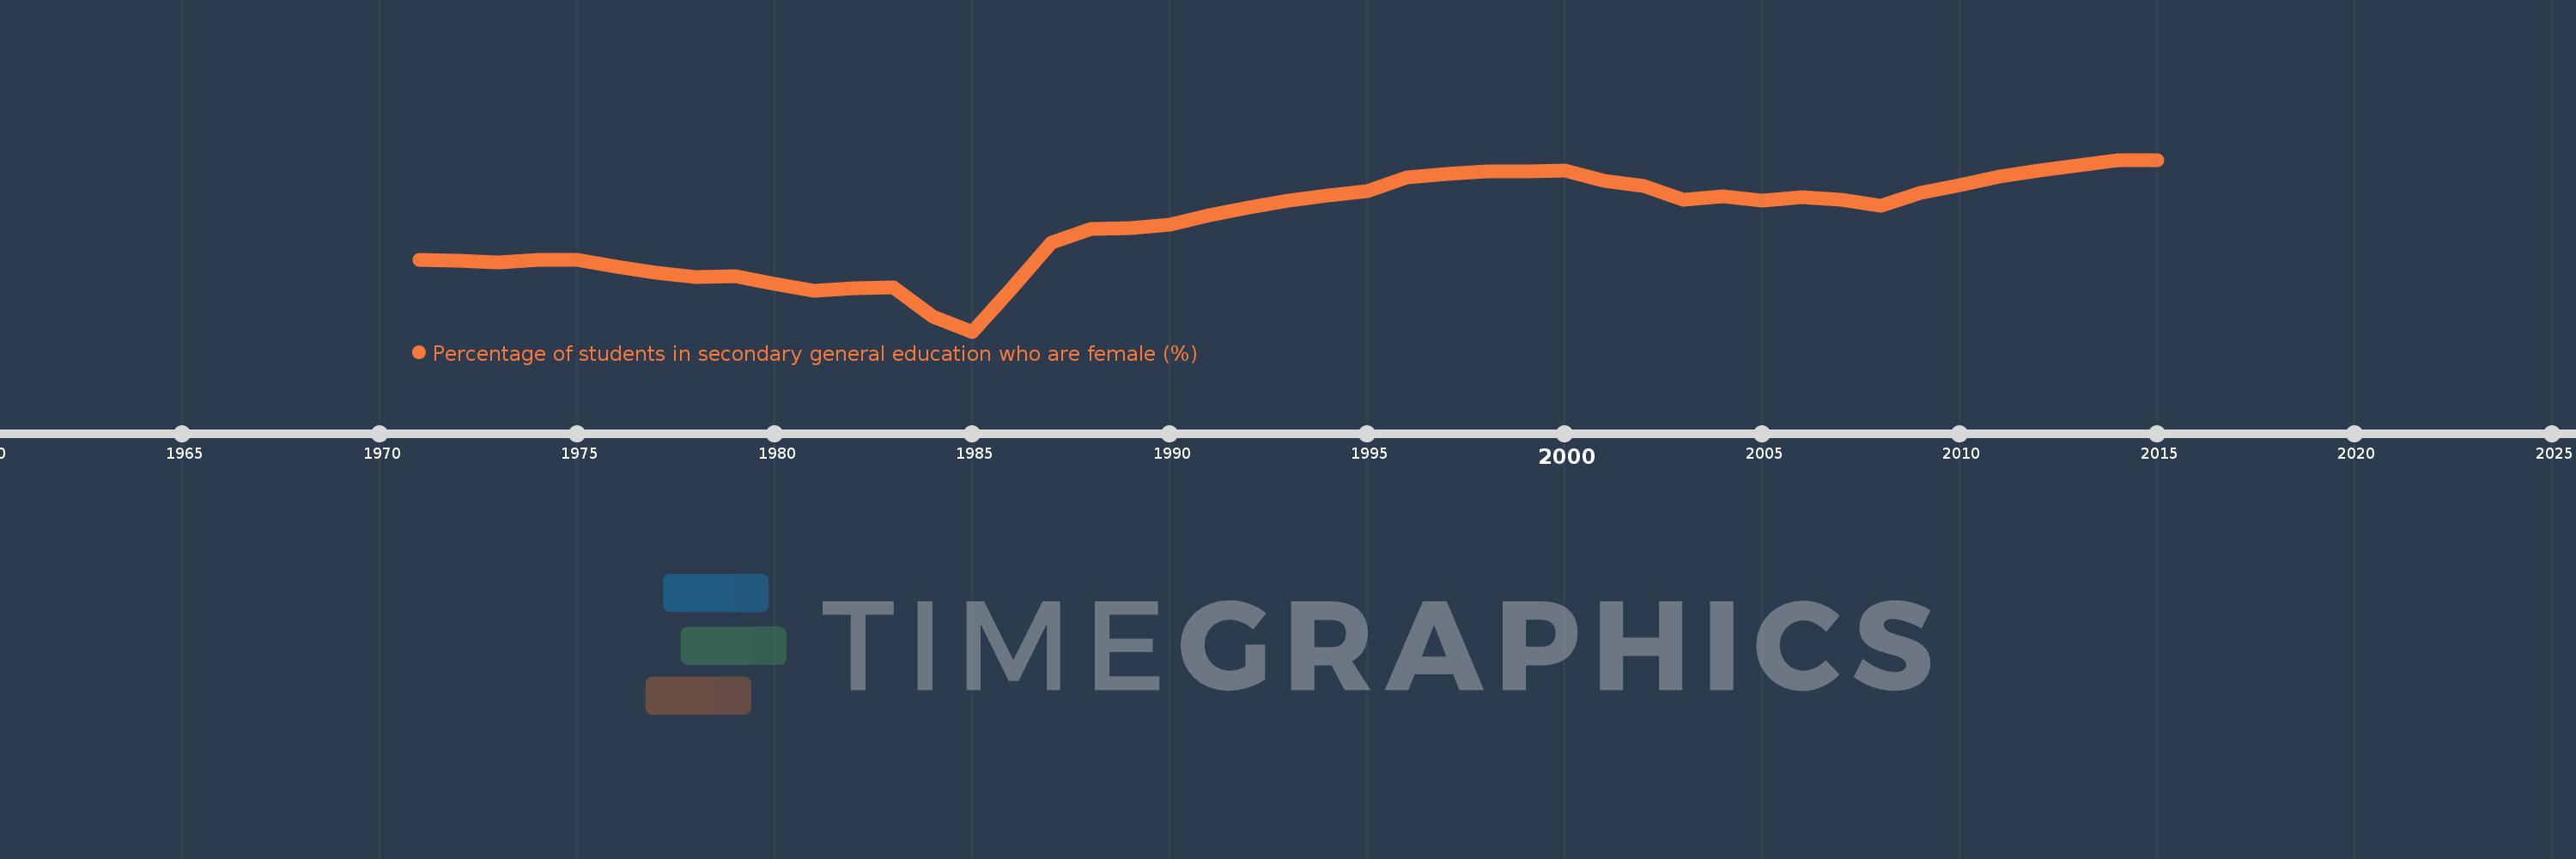
Percentage of students in secondary general education who are female (%)
2015,2014,2013,2012,2011,2010,2009,2008,2007,2006,2005,2004,2003,2002,2001,2000,1999,1998,1997,1996,1995,1994,1993,1992,1991,1990,1989,1988,1987,1986,1985,1984,1983,1982,1981,1980,1979,1978,1977,1976,1975,1974,1973,1972,1971
Estas estatísticas em outros países:
AfghanistanAlbaniaAlgeriaAndorraAngolaAntigua and BarbudaArab WorldArgentinaArmeniaArubaAustraliaAustriaAzerbaijanBahamas, TheBahrainBangladeshBarbadosBelarusBelgiumBelizeBeninBermudaBhutanBoliviaBosnia and HerzegovinaBotswanaBrazilBritish Virgin IslandsBrunei DarussalamBulgariaBurkina FasoBurundiCabo VerdeCambodiaCameroonCanadaCaribbean small statesCayman IslandsCentral African RepublicCentral Europe and the BalticsChadChileChinaColombiaComorosCongo, Dem. Rep.Congo, Rep.Costa RicaCote d'IvoireCroatiaCubaCuracaoCyprusCzech RepublicDenmarkDjiboutiDominicaDominican RepublicEarly-demographic dividendEast Asia & PacificEast Asia & Pacific (excluding high income)East Asia & Pacific (IDA & IBRD countries)EcuadorEgypt, Arab Rep.El SalvadorEquatorial GuineaEritreaEstoniaEthiopiaEuro areaEurope & Central AsiaEurope & Central Asia (excluding high income)Europe & Central Asia (IDA & IBRD countries)European UnionFijiFinlandFragile and conflict affected situationsFranceGabonGambia, TheGeorgiaGermanyGhanaGibraltarGreeceGrenadaGuatemalaGuineaGuinea-BissauGuyanaHaitiHeavily indebted poor countries (HIPC)High incomeHondurasHong Kong SAR, ChinaHungaryIBRD onlyIcelandIDA & IBRD totalIDA blendIDA onlyIDA totalIndiaIndonesiaIran, Islamic Rep.IraqIrelandIsraelItalyJamaicaJapanJordanKazakhstanKenyaKiribatiKorea, Dem. People’s Rep.Korea, Rep.KuwaitKyrgyz RepublicLao PDRLate-demographic dividendLatin America & Caribbean Latin America & Caribbean (excluding high income)Latin America & the Caribbean (IDA & IBRD countries)LatviaLeast developed countries: UN classificationLebanonLesothoLiberiaLibyaLiechtensteinLithuaniaLow & middle incomeLow incomeLower middle incomeLuxembourgMacao SAR, ChinaMacedonia, FYRMadagascarMalawiMalaysiaMaldivesMaliMaltaMarshall IslandsMauritaniaMauritiusMexicoMicronesia, Fed. Sts.Middle East & North AfricaMiddle East & North Africa (excluding high income)Middle East & North Africa (IDA & IBRD countries)Middle incomeMoldovaMonacoMongoliaMontenegroMoroccoMozambiqueMyanmarNamibiaNauruNepalNetherlandsNew ZealandNicaraguaNigerNigeriaNorth AmericaNorwayOECD membersOmanOther small statesPacific island small statesPakistanPalauPanamaPapua New GuineaParaguayPeruPhilippinesPolandPortugalPost-demographic dividendPre-demographic dividendPuerto RicoQatarRomaniaRussian FederationRwandaSamoaSan MarinoSao Tome and PrincipeSaudi ArabiaSenegalSerbiaSeychellesSierra LeoneSingaporeSint Maarten (Dutch part)Slovak RepublicSloveniaSmall statesSolomon IslandsSomaliaSouth AfricaSouth AsiaSouth Asia (IDA & IBRD)South SudanSpainSri LankaSt. Kitts and NevisSt. LuciaSt. Vincent and the GrenadinesSub-Saharan Africa Sub-Saharan Africa (excluding high income)Sub-Saharan Africa (IDA & IBRD countries)SudanSurinameSwazilandSwedenSwitzerlandSyrian Arab RepublicTajikistanTanzaniaThailandTimor-LesteTogoTongaTrinidad and TobagoTunisiaTurkeyTurkmenistanTurks and Caicos IslandsTuvaluUgandaUkraineUnited Arab EmiratesUnited KingdomUnited StatesUpper middle incomeUruguayUzbekistanVanuatuVenezuela, RBVietnamWest Bank and GazaWorldYemen, Rep.ZambiaZimbabwe Linha do tempo:
Nesta escala de tempo está apresentado um gráfico de 1971 ano até 2015 ano Sub-Saharan Africa (excluding high income). Dados de 1970 ano ausente. O número de observações reais por data: 45.
Fonte (nome):
Indicadores de desenvolvimento mundial
Fonte (organização):
UNESCO Institute for Statistics
Categorias:
Education, Gender
Foi atualizado:
23 abr 2017 ano
Indicadores de alterações dos valores ao longo dos anos
Mínimo:
37.959
1 jan 1985 ano
Máximo:
46.083
1 jan 2015 ano
Na data de observação
Valor
Mudança absoluta
A alteração em relação ao valor anterior
1 jan 1971 ano
41.354
+41.354
0.0%
1 jan 1972 ano
41.316
-0.038
-0.09%
1 jan 1973 ano
41.215
-0.101
-0.24%
1 jan 1974 ano
41.358
+0.143
0.35%
1 jan 1975 ano
41.358
+0.0
0.0%
1 jan 1976 ano
41.044
-0.314
-0.76%
1 jan 1977 ano
40.745
-0.299
-0.73%
1 jan 1978 ano
40.553
-0.193
-0.47%
1 jan 1979 ano
40.572
+0.019
0.05%
1 jan 1980 ano
40.202
-0.37
-0.91%
1 jan 1981 ano
39.893
-0.309
-0.77%
1 jan 1982 ano
40.01
+0.117
0.29%
1 jan 1983 ano
40.043
+0.033
0.08%
1 jan 1984 ano
38.677
-1.367
-3.41%
1 jan 1985 ano
37.959
-0.718
-1.86%
1 jan 1986 ano
40.021
+2.062
5.43%
1 jan 1987 ano
42.166
+2.145
5.36%
1 jan 1988 ano
42.796
+0.63
1.49%
1 jan 1989 ano
42.85
+0.054
0.13%
1 jan 1990 ano
43.018
+0.168
0.39%
1 jan 1991 ano
43.472
+0.454
1.06%
1 jan 1992 ano
43.825
+0.353
0.81%
1 jan 1993 ano
44.165
+0.34
0.78%
1 jan 1994 ano
44.413
+0.248
0.56%
1 jan 1995 ano
44.597
+0.184
0.42%
1 jan 1996 ano
45.235
+0.638
1.43%
1 jan 1997 ano
45.422
+0.186
0.41%
1 jan 1998 ano
45.551
+0.13
0.29%
1 jan 1999 ano
45.529
-0.022
-0.05%
1 jan 2000 ano
45.576
+0.047
0.1%
1 jan 2001 ano
45.081
-0.495
-1.09%
1 jan 2002 ano
44.862
-0.219
-0.48%
1 jan 2003 ano
44.174
-0.689
-1.53%
1 jan 2004 ano
44.353
+0.179
0.41%
1 jan 2005 ano
44.15
-0.203
-0.46%
1 jan 2006 ano
44.336
+0.186
0.42%
1 jan 2007 ano
44.2
-0.136
-0.31%
1 jan 2008 ano
43.894
-0.306
-0.69%
1 jan 2009 ano
44.514
+0.62
1.41%
1 jan 2010 ano
44.896
+0.382
0.86%
1 jan 2011 ano
45.306
+0.41
0.91%
1 jan 2012 ano
45.563
+0.258
0.57%
1 jan 2013 ano
45.801
+0.238
0.52%
1 jan 2014 ano
46.062
+0.261
0.57%
1 jan 2015 ano
46.083
+0.022
0.05%
Classificação de países por estatísticas atuais por anos


Comentários: