29
/pt/
pt
AIzaSyAYiBZKx7MnpbEhh9jyipgxe19OcubqV5w
April 1, 2024
26030
Central Europe and the Baltics
CEB
false
2
1
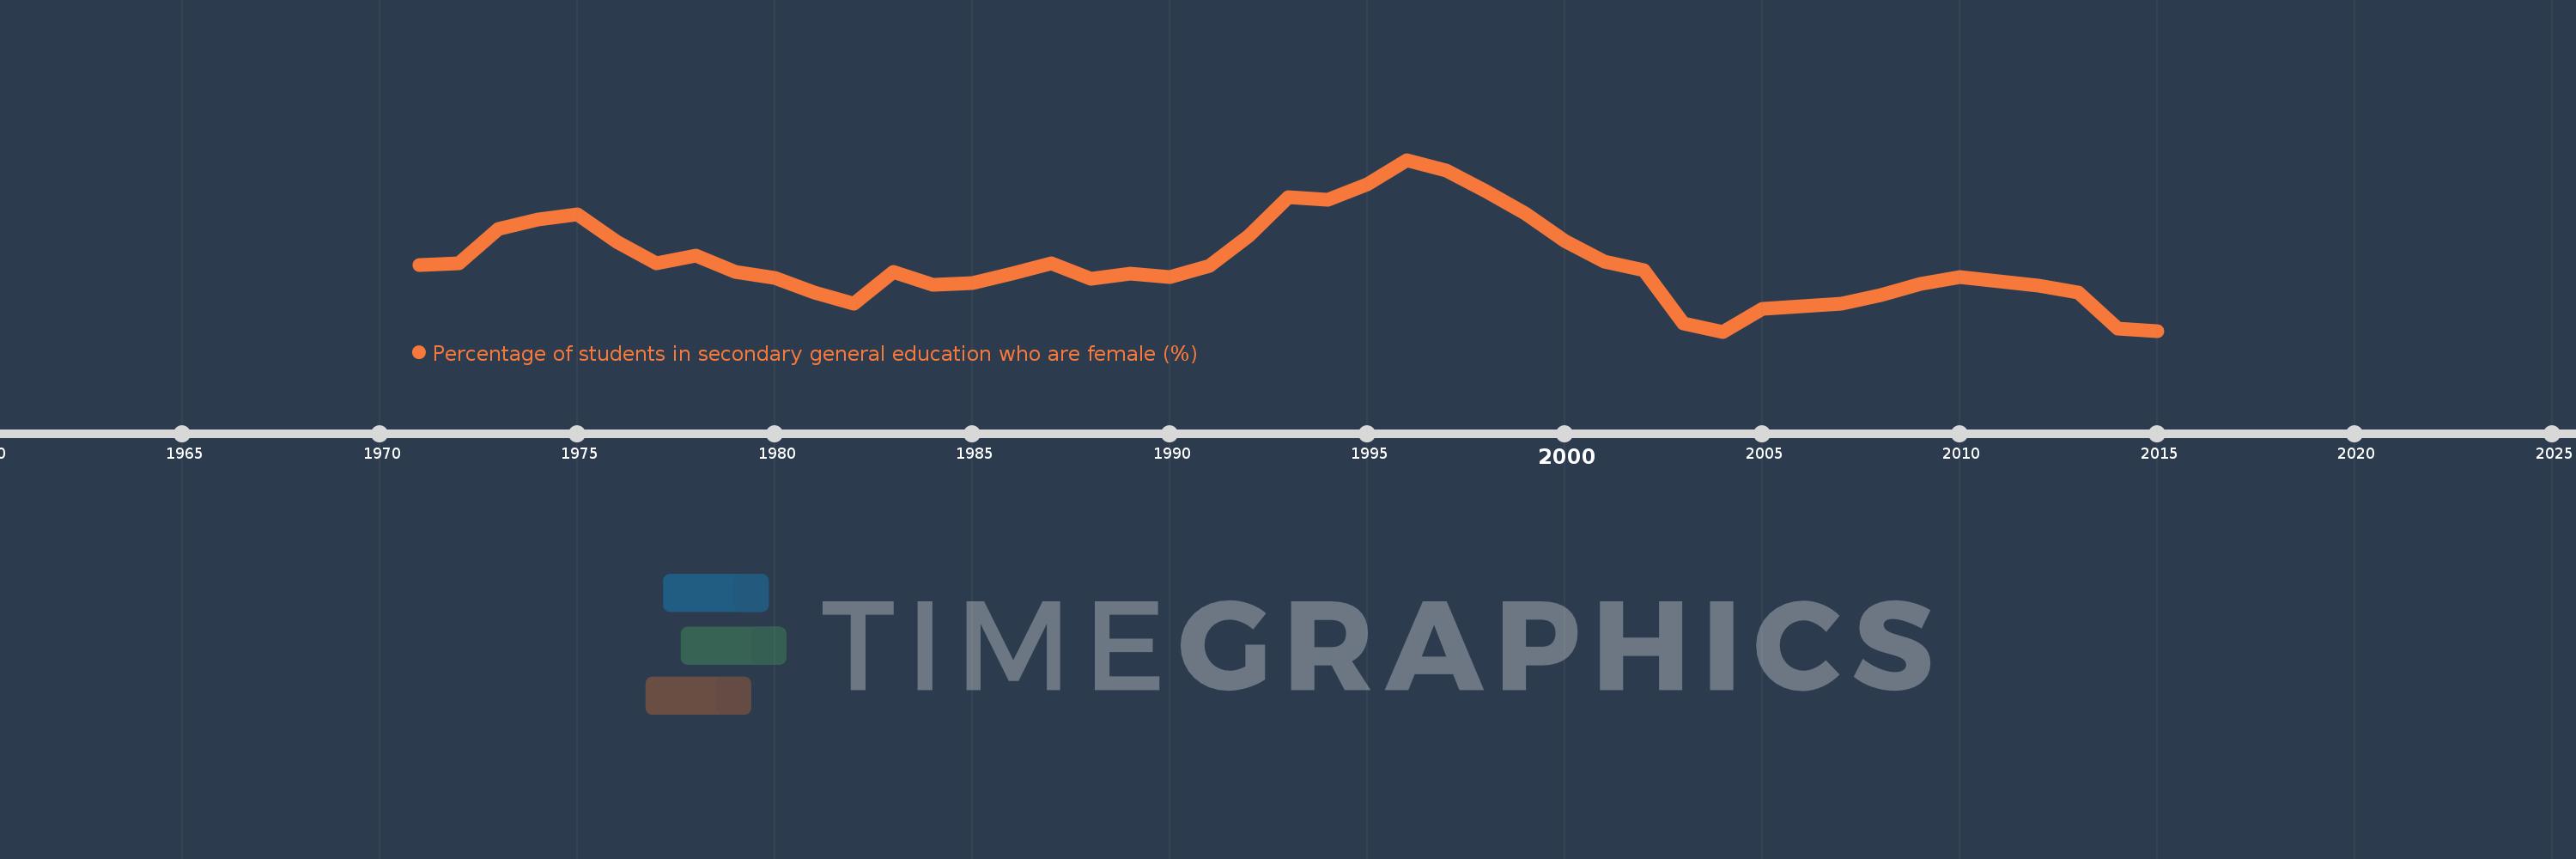
Percentage of students in secondary general education who are female (%)
2015,2014,2013,2012,2011,2010,2009,2008,2007,2006,2005,2004,2003,2002,2001,2000,1999,1998,1997,1996,1995,1994,1993,1992,1991,1990,1989,1988,1987,1986,1985,1984,1983,1982,1981,1980,1979,1978,1977,1976,1975,1974,1973,1972,1971
Estas estatísticas em outros países:
AfghanistanAlbaniaAlgeriaAndorraAngolaAntigua and BarbudaArab WorldArgentinaArmeniaArubaAustraliaAustriaAzerbaijanBahamas, TheBahrainBangladeshBarbadosBelarusBelgiumBelizeBeninBermudaBhutanBoliviaBosnia and HerzegovinaBotswanaBrazilBritish Virgin IslandsBrunei DarussalamBulgariaBurkina FasoBurundiCabo VerdeCambodiaCameroonCanadaCaribbean small statesCayman IslandsCentral African RepublicCentral Europe and the BalticsChadChileChinaColombiaComorosCongo, Dem. Rep.Congo, Rep.Costa RicaCote d'IvoireCroatiaCubaCuracaoCyprusCzech RepublicDenmarkDjiboutiDominicaDominican RepublicEarly-demographic dividendEast Asia & PacificEast Asia & Pacific (excluding high income)East Asia & Pacific (IDA & IBRD countries)EcuadorEgypt, Arab Rep.El SalvadorEquatorial GuineaEritreaEstoniaEthiopiaEuro areaEurope & Central AsiaEurope & Central Asia (excluding high income)Europe & Central Asia (IDA & IBRD countries)European UnionFijiFinlandFragile and conflict affected situationsFranceGabonGambia, TheGeorgiaGermanyGhanaGibraltarGreeceGrenadaGuatemalaGuineaGuinea-BissauGuyanaHaitiHeavily indebted poor countries (HIPC)High incomeHondurasHong Kong SAR, ChinaHungaryIBRD onlyIcelandIDA & IBRD totalIDA blendIDA onlyIDA totalIndiaIndonesiaIran, Islamic Rep.IraqIrelandIsraelItalyJamaicaJapanJordanKazakhstanKenyaKiribatiKorea, Dem. People’s Rep.Korea, Rep.KuwaitKyrgyz RepublicLao PDRLate-demographic dividendLatin America & Caribbean Latin America & Caribbean (excluding high income)Latin America & the Caribbean (IDA & IBRD countries)LatviaLeast developed countries: UN classificationLebanonLesothoLiberiaLibyaLiechtensteinLithuaniaLow & middle incomeLow incomeLower middle incomeLuxembourgMacao SAR, ChinaMacedonia, FYRMadagascarMalawiMalaysiaMaldivesMaliMaltaMarshall IslandsMauritaniaMauritiusMexicoMicronesia, Fed. Sts.Middle East & North AfricaMiddle East & North Africa (excluding high income)Middle East & North Africa (IDA & IBRD countries)Middle incomeMoldovaMonacoMongoliaMontenegroMoroccoMozambiqueMyanmarNamibiaNauruNepalNetherlandsNew ZealandNicaraguaNigerNigeriaNorth AmericaNorwayOECD membersOmanOther small statesPacific island small statesPakistanPalauPanamaPapua New GuineaParaguayPeruPhilippinesPolandPortugalPost-demographic dividendPre-demographic dividendPuerto RicoQatarRomaniaRussian FederationRwandaSamoaSan MarinoSao Tome and PrincipeSaudi ArabiaSenegalSerbiaSeychellesSierra LeoneSingaporeSint Maarten (Dutch part)Slovak RepublicSloveniaSmall statesSolomon IslandsSomaliaSouth AfricaSouth AsiaSouth Asia (IDA & IBRD)South SudanSpainSri LankaSt. Kitts and NevisSt. LuciaSt. Vincent and the GrenadinesSub-Saharan Africa Sub-Saharan Africa (excluding high income)Sub-Saharan Africa (IDA & IBRD countries)SudanSurinameSwazilandSwedenSwitzerlandSyrian Arab RepublicTajikistanTanzaniaThailandTimor-LesteTogoTongaTrinidad and TobagoTunisiaTurkeyTurkmenistanTurks and Caicos IslandsTuvaluUgandaUkraineUnited Arab EmiratesUnited KingdomUnited StatesUpper middle incomeUruguayUzbekistanVanuatuVenezuela, RBVietnamWest Bank and GazaWorldYemen, Rep.ZambiaZimbabwe Linha do tempo:
Nesta escala de tempo está apresentado um gráfico de 1971 ano até 2015 ano Central Europe and the Baltics. Dados de 1970 ano ausente. O número de observações reais por data: 45.
Fonte (nome):
Indicadores de desenvolvimento mundial
Fonte (organização):
UNESCO Institute for Statistics
Categorias:
Education, Gender
Foi atualizado:
23 abr 2017 ano
Indicadores de alterações dos valores ao longo dos anos
Mínimo:
51.191
1 jan 2004 ano
Máximo:
53.122
1 jan 1996 ano
Na data de observação
Valor
Mudança absoluta
A alteração em relação ao valor anterior
1 jan 1971 ano
51.943
+51.943
0.0%
1 jan 1972 ano
51.96
+0.017
0.03%
1 jan 1973 ano
52.344
+0.384
0.74%
1 jan 1974 ano
52.454
+0.109
0.21%
1 jan 1975 ano
52.51
+0.057
0.11%
1 jan 1976 ano
52.198
-0.312
-0.59%
1 jan 1977 ano
51.959
-0.239
-0.46%
1 jan 1978 ano
52.043
+0.084
0.16%
1 jan 1979 ano
51.86
-0.182
-0.35%
1 jan 1980 ano
51.791
-0.069
-0.13%
1 jan 1981 ano
51.63
-0.161
-0.31%
1 jan 1982 ano
51.506
-0.124
-0.24%
1 jan 1983 ano
51.861
+0.355
0.69%
1 jan 1984 ano
51.717
-0.145
-0.28%
1 jan 1985 ano
51.738
+0.022
0.04%
1 jan 1986 ano
51.841
+0.102
0.2%
1 jan 1987 ano
51.959
+0.119
0.23%
1 jan 1988 ano
51.781
-0.178
-0.34%
1 jan 1989 ano
51.844
+0.062
0.12%
1 jan 1990 ano
51.807
-0.036
-0.07%
1 jan 1991 ano
51.926
+0.119
0.23%
1 jan 1992 ano
52.267
+0.341
0.66%
1 jan 1993 ano
52.706
+0.439
0.84%
1 jan 1994 ano
52.676
-0.03
-0.06%
1 jan 1995 ano
52.849
+0.173
0.33%
1 jan 1996 ano
53.122
+0.273
0.52%
1 jan 1997 ano
53.0
-0.122
-0.23%
1 jan 1998 ano
52.768
-0.233
-0.44%
1 jan 1999 ano
52.521
-0.246
-0.47%
1 jan 2000 ano
52.206
-0.315
-0.6%
1 jan 2001 ano
51.975
-0.232
-0.44%
1 jan 2002 ano
51.88
-0.095
-0.18%
1 jan 2003 ano
51.286
-0.594
-1.14%
1 jan 2004 ano
51.191
-0.095
-0.19%
1 jan 2005 ano
51.448
+0.257
0.5%
1 jan 2006 ano
51.48
+0.032
0.06%
1 jan 2007 ano
51.5
+0.02
0.04%
1 jan 2008 ano
51.599
+0.099
0.19%
1 jan 2009 ano
51.728
+0.13
0.25%
1 jan 2010 ano
51.808
+0.079
0.15%
1 jan 2011 ano
51.76
-0.047
-0.09%
1 jan 2012 ano
51.704
-0.056
-0.11%
1 jan 2013 ano
51.626
-0.078
-0.15%
1 jan 2014 ano
51.223
-0.403
-0.78%
1 jan 2015 ano
51.194
-0.03
-0.06%
Classificação de países por estatísticas atuais por anos


Comentários: