29
/pt/
pt
AIzaSyAYiBZKx7MnpbEhh9jyipgxe19OcubqV5w
April 1, 2024
148370
Guyana
GUY
true
2
1
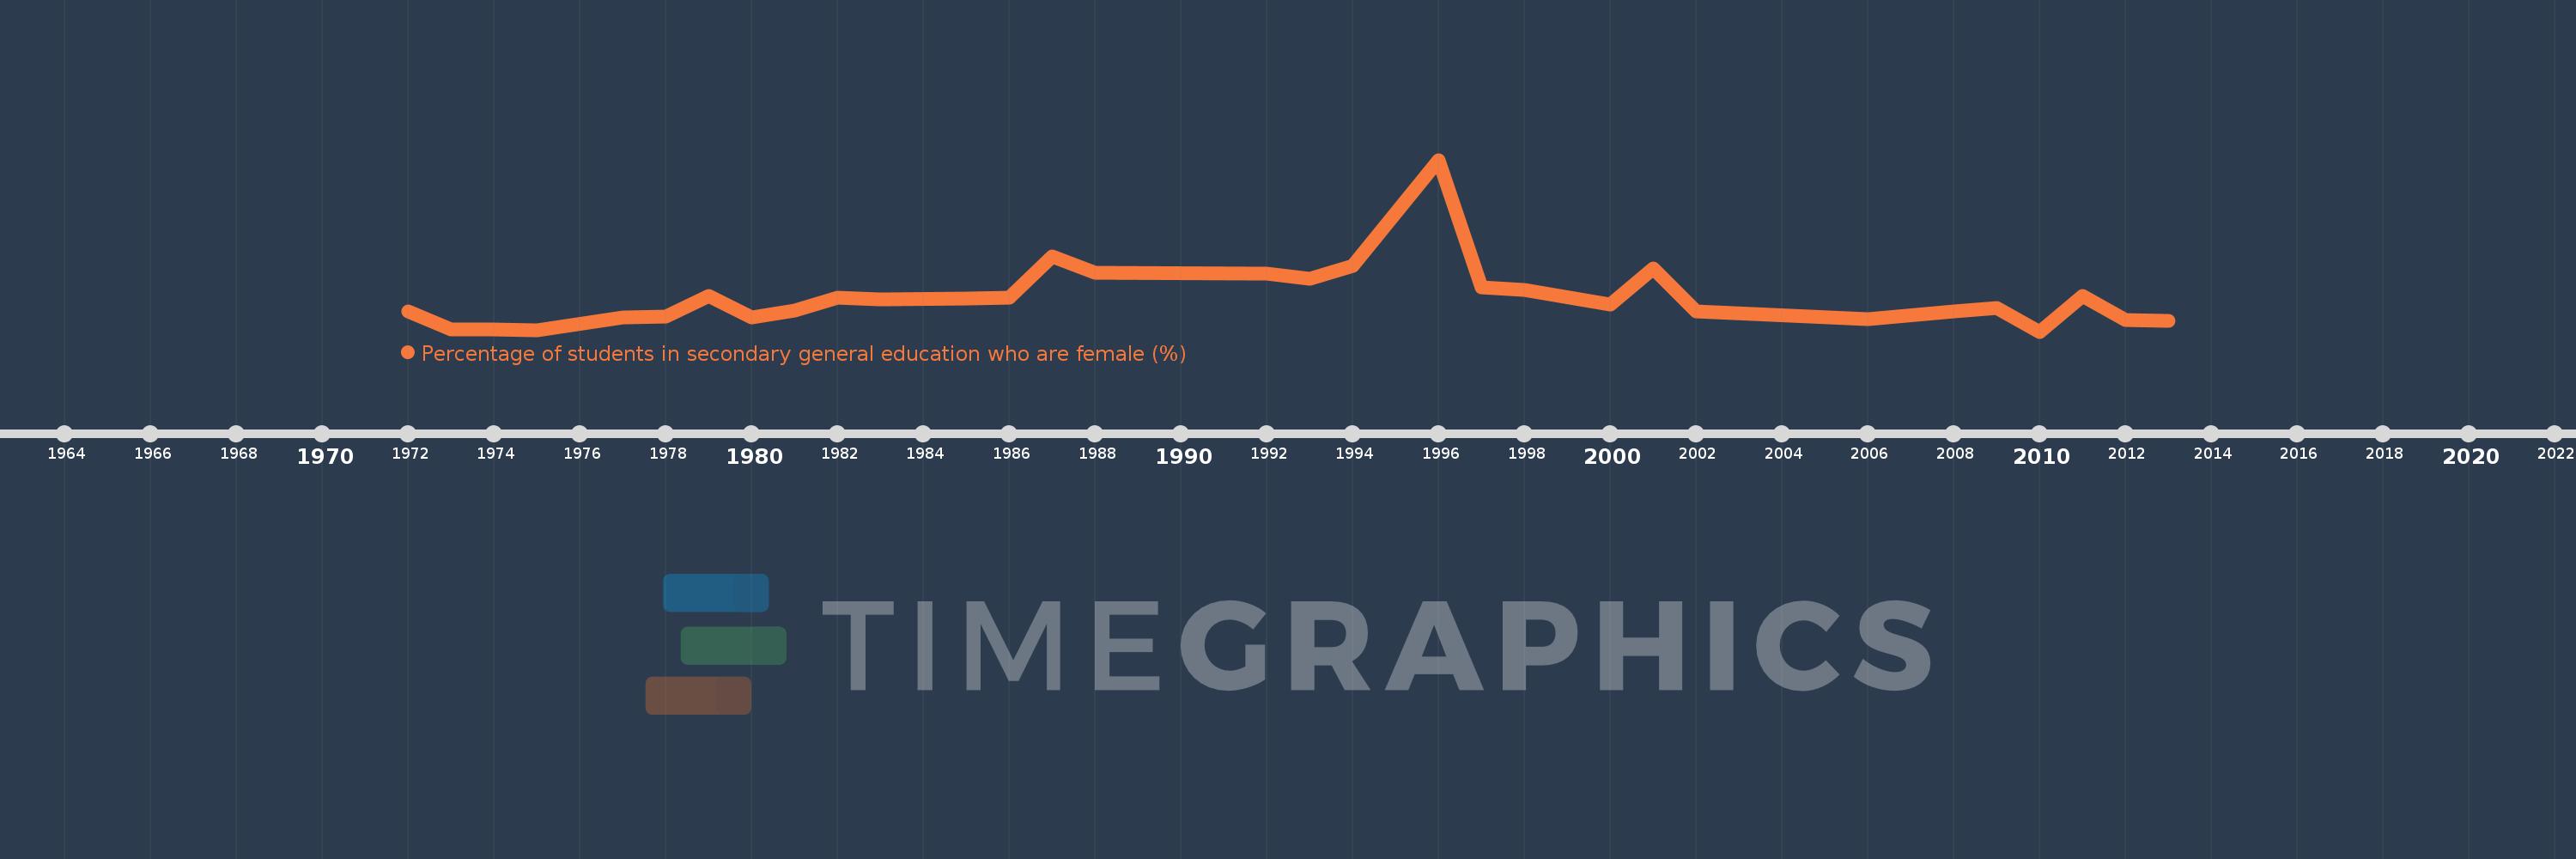
Percentage of students in secondary general education who are female (%)
2013,2012,2011,2010,2009,2008,2006,2002,2001,2000,1998,1997,1996,1994,1993,1992,1988,1987,1986,1985,1983,1982,1981,1980,1979,1978,1977,1975,1974,1973,1972
Estas estatísticas em outros países:
AfghanistanAlbaniaAlgeriaAndorraAngolaAntigua and BarbudaArab WorldArgentinaArmeniaArubaAustraliaAustriaAzerbaijanBahamas, TheBahrainBangladeshBarbadosBelarusBelgiumBelizeBeninBermudaBhutanBoliviaBosnia and HerzegovinaBotswanaBrazilBritish Virgin IslandsBrunei DarussalamBulgariaBurkina FasoBurundiCabo VerdeCambodiaCameroonCanadaCaribbean small statesCayman IslandsCentral African RepublicCentral Europe and the BalticsChadChileChinaColombiaComorosCongo, Dem. Rep.Congo, Rep.Costa RicaCote d'IvoireCroatiaCubaCuracaoCyprusCzech RepublicDenmarkDjiboutiDominicaDominican RepublicEarly-demographic dividendEast Asia & PacificEast Asia & Pacific (excluding high income)East Asia & Pacific (IDA & IBRD countries)EcuadorEgypt, Arab Rep.El SalvadorEquatorial GuineaEritreaEstoniaEthiopiaEuro areaEurope & Central AsiaEurope & Central Asia (excluding high income)Europe & Central Asia (IDA & IBRD countries)European UnionFijiFinlandFragile and conflict affected situationsFranceGabonGambia, TheGeorgiaGermanyGhanaGibraltarGreeceGrenadaGuatemalaGuineaGuinea-BissauGuyanaHaitiHeavily indebted poor countries (HIPC)High incomeHondurasHong Kong SAR, ChinaHungaryIBRD onlyIcelandIDA & IBRD totalIDA blendIDA onlyIDA totalIndiaIndonesiaIran, Islamic Rep.IraqIrelandIsraelItalyJamaicaJapanJordanKazakhstanKenyaKiribatiKorea, Dem. People’s Rep.Korea, Rep.KuwaitKyrgyz RepublicLao PDRLate-demographic dividendLatin America & Caribbean Latin America & Caribbean (excluding high income)Latin America & the Caribbean (IDA & IBRD countries)LatviaLeast developed countries: UN classificationLebanonLesothoLiberiaLibyaLiechtensteinLithuaniaLow & middle incomeLow incomeLower middle incomeLuxembourgMacao SAR, ChinaMacedonia, FYRMadagascarMalawiMalaysiaMaldivesMaliMaltaMarshall IslandsMauritaniaMauritiusMexicoMicronesia, Fed. Sts.Middle East & North AfricaMiddle East & North Africa (excluding high income)Middle East & North Africa (IDA & IBRD countries)Middle incomeMoldovaMonacoMongoliaMontenegroMoroccoMozambiqueMyanmarNamibiaNauruNepalNetherlandsNew ZealandNicaraguaNigerNigeriaNorth AmericaNorwayOECD membersOmanOther small statesPacific island small statesPakistanPalauPanamaPapua New GuineaParaguayPeruPhilippinesPolandPortugalPost-demographic dividendPre-demographic dividendPuerto RicoQatarRomaniaRussian FederationRwandaSamoaSan MarinoSao Tome and PrincipeSaudi ArabiaSenegalSerbiaSeychellesSierra LeoneSingaporeSint Maarten (Dutch part)Slovak RepublicSloveniaSmall statesSolomon IslandsSomaliaSouth AfricaSouth AsiaSouth Asia (IDA & IBRD)South SudanSpainSri LankaSt. Kitts and NevisSt. LuciaSt. Vincent and the GrenadinesSub-Saharan Africa Sub-Saharan Africa (excluding high income)Sub-Saharan Africa (IDA & IBRD countries)SudanSurinameSwazilandSwedenSwitzerlandSyrian Arab RepublicTajikistanTanzaniaThailandTimor-LesteTogoTongaTrinidad and TobagoTunisiaTurkeyTurkmenistanTurks and Caicos IslandsTuvaluUgandaUkraineUnited Arab EmiratesUnited KingdomUnited StatesUpper middle incomeUruguayUzbekistanVanuatuVenezuela, RBVietnamWest Bank and GazaWorldYemen, Rep.ZambiaZimbabwe Linha do tempo:
Nesta escala de tempo está apresentado um gráfico de 1972 ano até 2013 ano Guyana. Dados de 1971 ano ausente. O número de observações reais por data: 31.
Fonte (nome):
Indicadores de desenvolvimento mundial
Fonte (organização):
UNESCO Institute for Statistics
Categorias:
Education, Gender
Foi atualizado:
23 abr 2017 ano
Indicadores de alterações dos valores ao longo dos anos
Mínimo:
50.165
1 jan 2010 ano
Máximo:
54.961
1 jan 1996 ano
Na data de observação
Valor
Mudança absoluta
A alteração em relação ao valor anterior
1 jan 1972 ano
50.721
+50.721
0.0%
1 jan 1973 ano
50.216
-0.505
-0.99%
1 jan 1974 ano
50.234
+0.018
0.04%
1 jan 1975 ano
50.196
-0.038
-0.08%
1 jan 1977 ano
50.553
+0.357
0.71%
1 jan 1978 ano
50.574
+0.02
0.04%
1 jan 1979 ano
51.159
+0.585
1.16%
1 jan 1980 ano
50.561
-0.598
-1.17%
1 jan 1981 ano
50.757
+0.196
0.39%
1 jan 1982 ano
51.11
+0.353
0.7%
1 jan 1983 ano
51.062
-0.049
-0.1%
1 jan 1985 ano
51.093
+0.031
0.06%
1 jan 1986 ano
51.113
+0.02
0.04%
1 jan 1987 ano
52.263
+1.15
2.25%
1 jan 1988 ano
51.802
-0.461
-0.88%
1 jan 1992 ano
51.786
-0.016
-0.03%
1 jan 1993 ano
51.648
-0.139
-0.27%
1 jan 1994 ano
51.994
+0.346
0.67%
1 jan 1996 ano
54.961
+2.967
5.71%
1 jan 1997 ano
51.396
-3.565
-6.49%
1 jan 1998 ano
51.327
-0.069
-0.13%
1 jan 2000 ano
50.926
-0.401
-0.78%
1 jan 2001 ano
51.923
+0.997
1.96%
1 jan 2002 ano
50.723
-1.2
-2.31%
1 jan 2006 ano
50.521
-0.202
-0.4%
1 jan 2008 ano
50.72
+0.199
0.39%
1 jan 2009 ano
50.825
+0.104
0.21%
1 jan 2010 ano
50.165
-0.66
-1.3%
1 jan 2011 ano
51.165
+1.0
1.99%
1 jan 2012 ano
50.491
-0.674
-1.32%
1 jan 2013 ano
50.469
-0.021
-0.04%
Classificação de países por estatísticas atuais por anos


Comentários: