29
/pt/
pt
AIzaSyAYiBZKx7MnpbEhh9jyipgxe19OcubqV5w
April 1, 2024
114053
Cote d'Ivoire
CIV
true
2
1
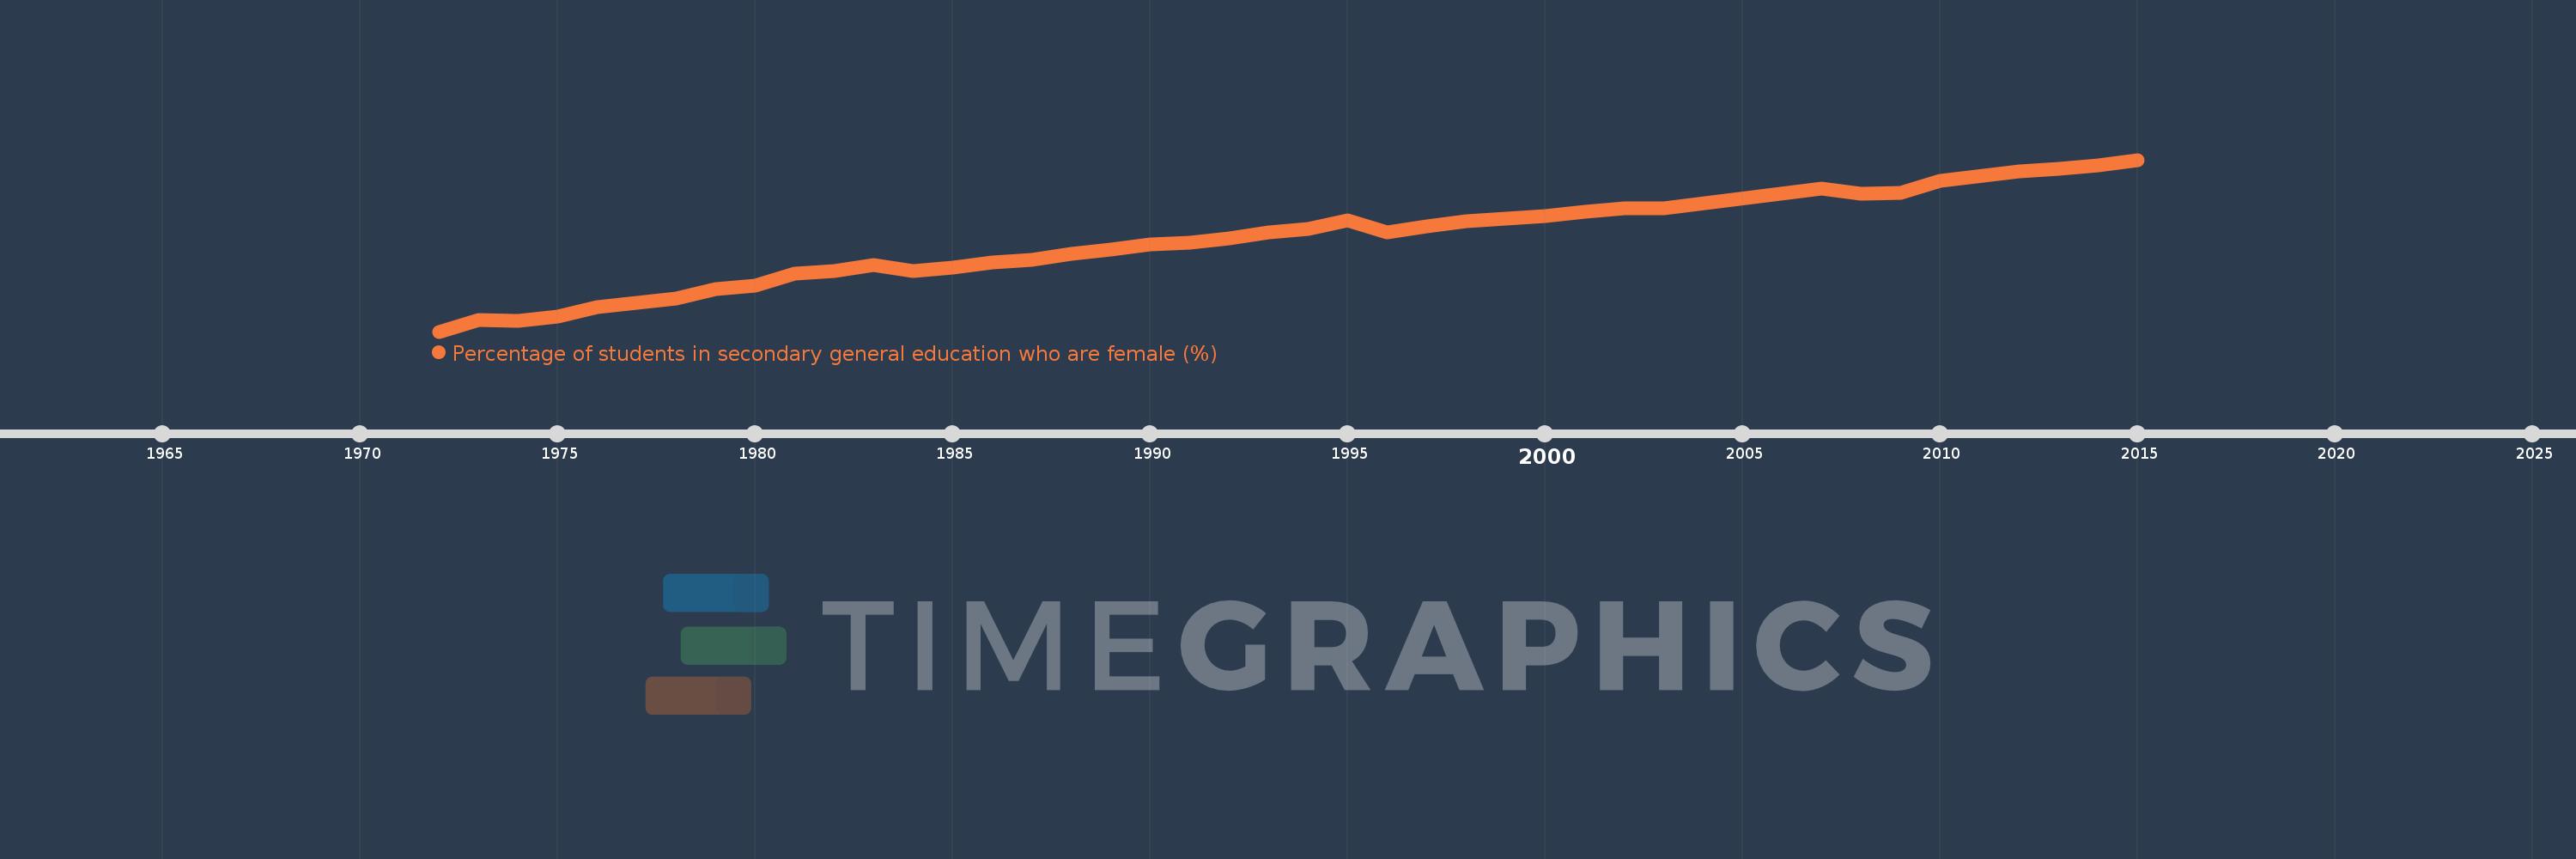
Percentage of students in secondary general education who are female (%)
2015,2014,2013,2012,2010,2009,2008,2007,2003,2002,2001,2000,1999,1998,1997,1996,1995,1994,1993,1992,1991,1990,1989,1988,1987,1986,1985,1984,1983,1982,1981,1980,1979,1978,1977,1976,1975,1974,1973,1972
Estas estatísticas em outros países:
AfghanistanAlbaniaAlgeriaAndorraAngolaAntigua and BarbudaArab WorldArgentinaArmeniaArubaAustraliaAustriaAzerbaijanBahamas, TheBahrainBangladeshBarbadosBelarusBelgiumBelizeBeninBermudaBhutanBoliviaBosnia and HerzegovinaBotswanaBrazilBritish Virgin IslandsBrunei DarussalamBulgariaBurkina FasoBurundiCabo VerdeCambodiaCameroonCanadaCaribbean small statesCayman IslandsCentral African RepublicCentral Europe and the BalticsChadChileChinaColombiaComorosCongo, Dem. Rep.Congo, Rep.Costa RicaCote d'IvoireCroatiaCubaCuracaoCyprusCzech RepublicDenmarkDjiboutiDominicaDominican RepublicEarly-demographic dividendEast Asia & PacificEast Asia & Pacific (excluding high income)East Asia & Pacific (IDA & IBRD countries)EcuadorEgypt, Arab Rep.El SalvadorEquatorial GuineaEritreaEstoniaEthiopiaEuro areaEurope & Central AsiaEurope & Central Asia (excluding high income)Europe & Central Asia (IDA & IBRD countries)European UnionFijiFinlandFragile and conflict affected situationsFranceGabonGambia, TheGeorgiaGermanyGhanaGibraltarGreeceGrenadaGuatemalaGuineaGuinea-BissauGuyanaHaitiHeavily indebted poor countries (HIPC)High incomeHondurasHong Kong SAR, ChinaHungaryIBRD onlyIcelandIDA & IBRD totalIDA blendIDA onlyIDA totalIndiaIndonesiaIran, Islamic Rep.IraqIrelandIsraelItalyJamaicaJapanJordanKazakhstanKenyaKiribatiKorea, Dem. People’s Rep.Korea, Rep.KuwaitKyrgyz RepublicLao PDRLate-demographic dividendLatin America & Caribbean Latin America & Caribbean (excluding high income)Latin America & the Caribbean (IDA & IBRD countries)LatviaLeast developed countries: UN classificationLebanonLesothoLiberiaLibyaLiechtensteinLithuaniaLow & middle incomeLow incomeLower middle incomeLuxembourgMacao SAR, ChinaMacedonia, FYRMadagascarMalawiMalaysiaMaldivesMaliMaltaMarshall IslandsMauritaniaMauritiusMexicoMicronesia, Fed. Sts.Middle East & North AfricaMiddle East & North Africa (excluding high income)Middle East & North Africa (IDA & IBRD countries)Middle incomeMoldovaMonacoMongoliaMontenegroMoroccoMozambiqueMyanmarNamibiaNauruNepalNetherlandsNew ZealandNicaraguaNigerNigeriaNorth AmericaNorwayOECD membersOmanOther small statesPacific island small statesPakistanPalauPanamaPapua New GuineaParaguayPeruPhilippinesPolandPortugalPost-demographic dividendPre-demographic dividendPuerto RicoQatarRomaniaRussian FederationRwandaSamoaSan MarinoSao Tome and PrincipeSaudi ArabiaSenegalSerbiaSeychellesSierra LeoneSingaporeSint Maarten (Dutch part)Slovak RepublicSloveniaSmall statesSolomon IslandsSomaliaSouth AfricaSouth AsiaSouth Asia (IDA & IBRD)South SudanSpainSri LankaSt. Kitts and NevisSt. LuciaSt. Vincent and the GrenadinesSub-Saharan Africa Sub-Saharan Africa (excluding high income)Sub-Saharan Africa (IDA & IBRD countries)SudanSurinameSwazilandSwedenSwitzerlandSyrian Arab RepublicTajikistanTanzaniaThailandTimor-LesteTogoTongaTrinidad and TobagoTunisiaTurkeyTurkmenistanTurks and Caicos IslandsTuvaluUgandaUkraineUnited Arab EmiratesUnited KingdomUnited StatesUpper middle incomeUruguayUzbekistanVanuatuVenezuela, RBVietnamWest Bank and GazaWorldYemen, Rep.ZambiaZimbabwe Linha do tempo:
Nesta escala de tempo está apresentado um gráfico de 1972 ano até 2015 ano Cote d'Ivoire. Dados de 1971 ano ausente. O número de observações reais por data: 40.
Fonte (nome):
Indicadores de desenvolvimento mundial
Fonte (organização):
UNESCO Institute for Statistics
Categorias:
Education, Gender
Foi atualizado:
23 abr 2017 ano
Indicadores de alterações dos valores ao longo dos anos
Mínimo:
21.42
1 jan 1972 ano
Máximo:
40.483
1 jan 2015 ano
Na data de observação
Valor
Mudança absoluta
A alteração em relação ao valor anterior
1 jan 1972 ano
21.42
+21.42
0.0%
1 jan 1973 ano
22.665
+1.245
5.81%
1 jan 1974 ano
22.596
-0.068
-0.3%
1 jan 1975 ano
23.133
+0.537
2.38%
1 jan 1976 ano
24.149
+1.016
4.39%
1 jan 1977 ano
24.619
+0.47
1.95%
1 jan 1978 ano
25.087
+0.468
1.9%
1 jan 1979 ano
26.112
+1.025
4.09%
1 jan 1980 ano
26.473
+0.361
1.38%
1 jan 1981 ano
27.874
+1.401
5.29%
1 jan 1982 ano
28.168
+0.294
1.05%
1 jan 1983 ano
28.793
+0.625
2.22%
1 jan 1984 ano
28.161
-0.631
-2.19%
1 jan 1985 ano
28.497
+0.336
1.19%
1 jan 1986 ano
29.047
+0.55
1.93%
1 jan 1987 ano
29.334
+0.287
0.99%
1 jan 1988 ano
30.037
+0.703
2.4%
1 jan 1989 ano
30.478
+0.441
1.47%
1 jan 1990 ano
31.058
+0.58
1.9%
1 jan 1991 ano
31.241
+0.183
0.59%
1 jan 1992 ano
31.807
+0.566
1.81%
1 jan 1993 ano
32.47
+0.663
2.09%
1 jan 1994 ano
32.789
+0.319
0.98%
1 jan 1995 ano
33.794
+1.005
3.07%
1 jan 1996 ano
32.42
-1.374
-4.07%
1 jan 1997 ano
33.071
+0.651
2.01%
1 jan 1998 ano
33.625
+0.554
1.68%
1 jan 1999 ano
33.994
+0.369
1.1%
1 jan 2000 ano
34.239
+0.246
0.72%
1 jan 2001 ano
34.715
+0.476
1.39%
1 jan 2002 ano
35.122
+0.407
1.17%
1 jan 2003 ano
35.116
-0.006
-0.02%
1 jan 2007 ano
37.288
+2.172
6.19%
1 jan 2008 ano
36.697
-0.591
-1.58%
1 jan 2009 ano
36.806
+0.109
0.3%
1 jan 2010 ano
38.143
+1.337
3.63%
1 jan 2012 ano
39.207
+1.063
2.79%
1 jan 2013 ano
39.512
+0.305
0.78%
1 jan 2014 ano
39.875
+0.364
0.92%
1 jan 2015 ano
40.483
+0.608
1.52%
Classificação de países por estatísticas atuais por anos


Comentários: