29
/pt/
pt
AIzaSyAYiBZKx7MnpbEhh9jyipgxe19OcubqV5w
April 1, 2024
58787
Sub-Saharan Africa
SSF
false
2
1
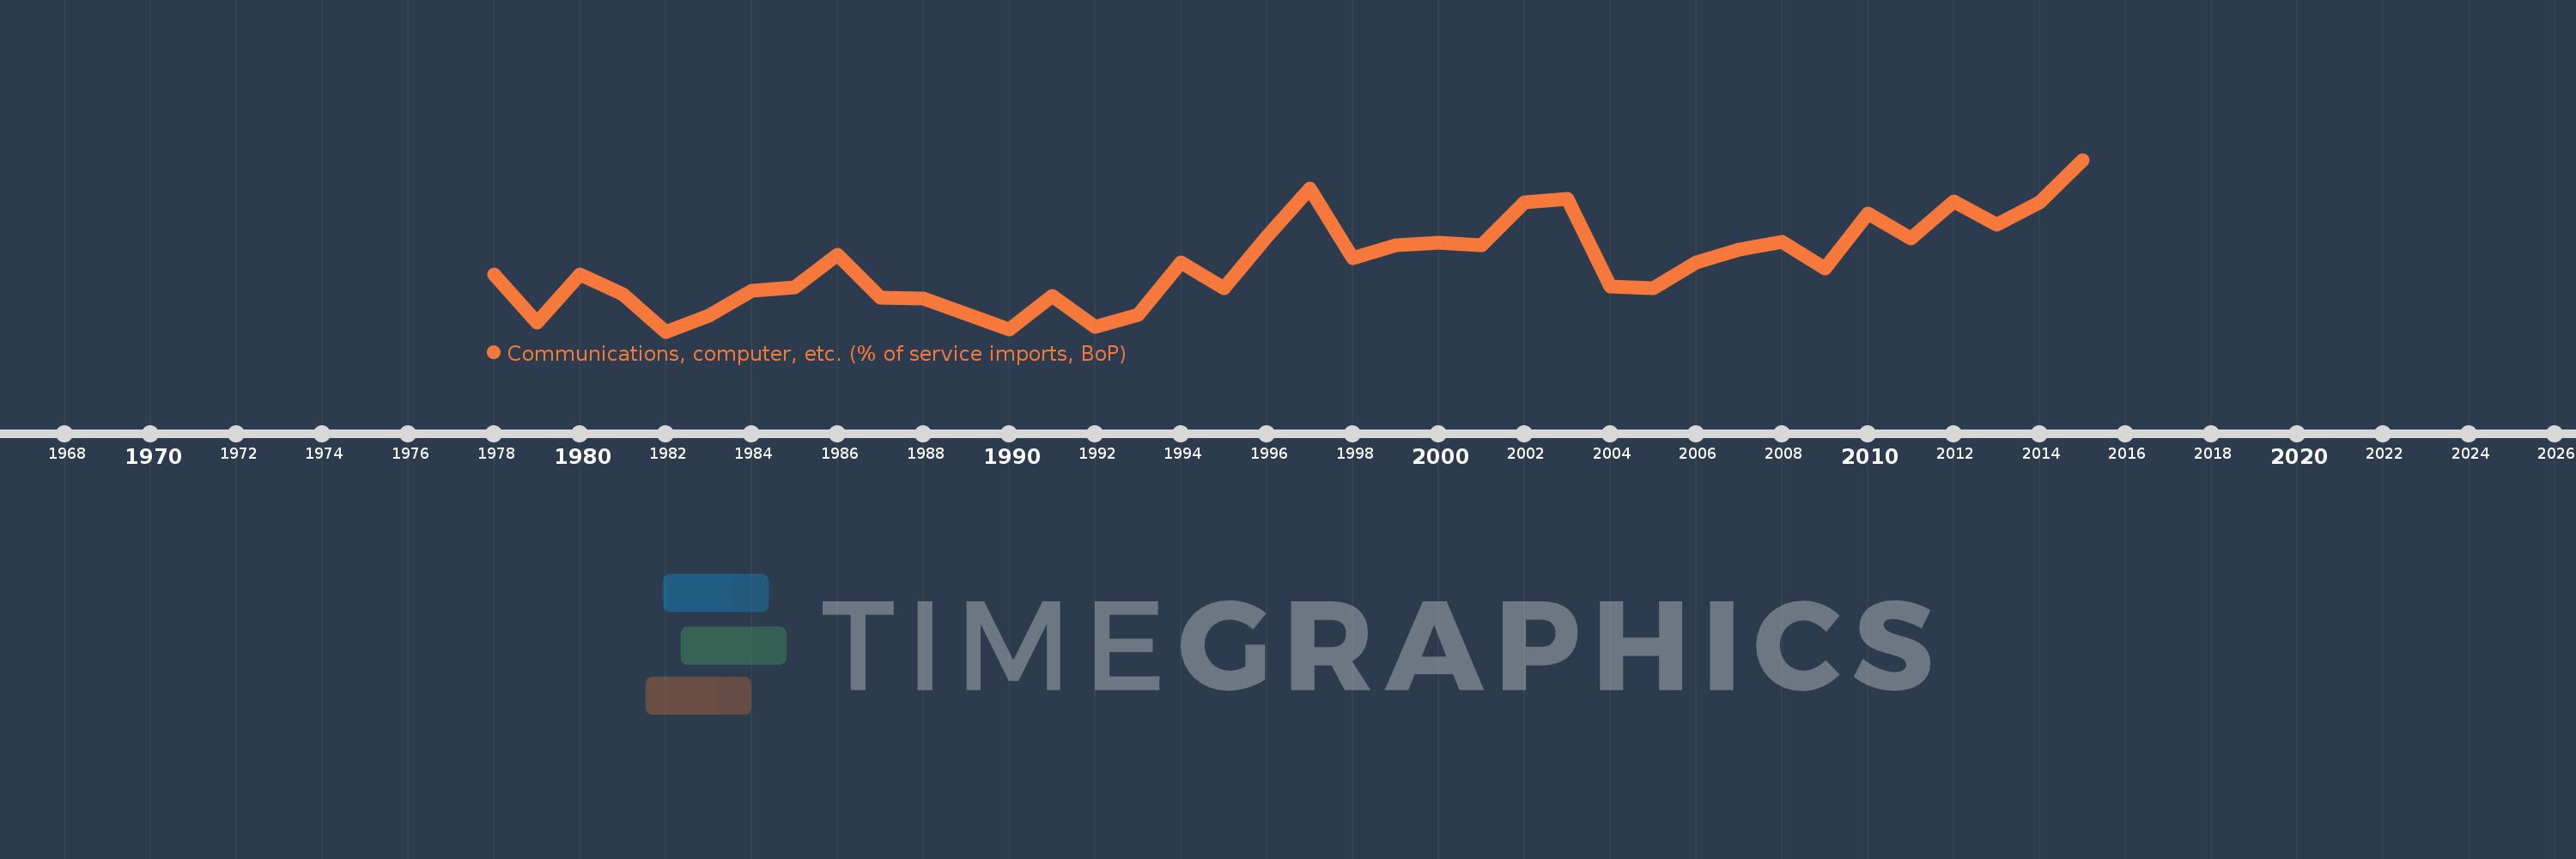
Communications, computer, etc. (% of service imports, BoP)
2015,2014,2013,2012,2011,2010,2009,2008,2007,2006,2005,2004,2003,2002,2001,2000,1999,1998,1997,1996,1995,1994,1993,1992,1991,1990,1989,1988,1987,1986,1985,1984,1983,1982,1981,1980,1979,1978
Estas estatísticas em outros países:
AfghanistanAlbaniaAlgeriaAngolaAntigua and BarbudaArab WorldArgentinaArmeniaArubaAustraliaAustriaAzerbaijanBahamas, TheBahrainBangladeshBarbadosBelarusBelgiumBelizeBeninBermudaBhutanBoliviaBosnia and HerzegovinaBotswanaBrazilBrunei DarussalamBulgariaBurkina FasoBurundiCabo VerdeCambodiaCameroonCanadaCaribbean small statesCentral African RepublicCentral Europe and the BalticsChadChileChinaColombiaComorosCongo, Dem. Rep.Congo, Rep.Costa RicaCote d'IvoireCroatiaCuracaoCyprusCzech RepublicDenmarkDjiboutiDominicaDominican RepublicEarly-demographic dividendEast Asia & PacificEast Asia & Pacific (excluding high income)East Asia & Pacific (IDA & IBRD countries)EcuadorEgypt, Arab Rep.El SalvadorEquatorial GuineaEritreaEstoniaEthiopiaEuro areaEurope & Central AsiaEurope & Central Asia (excluding high income)Europe & Central Asia (IDA & IBRD countries)European UnionFaroe IslandsFijiFinlandFragile and conflict affected situationsFranceFrench PolynesiaGabonGambia, TheGeorgiaGermanyGhanaGreeceGrenadaGuatemalaGuineaGuinea-BissauGuyanaHaitiHeavily indebted poor countries (HIPC)High incomeHondurasHong Kong SAR, ChinaHungaryIBRD onlyIcelandIDA & IBRD totalIDA onlyIDA totalIndiaIndonesiaIran, Islamic Rep.IraqIrelandIsraelItalyJamaicaJapanJordanKazakhstanKenyaKiribatiKorea, Rep.KosovoKuwaitKyrgyz RepublicLao PDRLate-demographic dividendLatin America & Caribbean Latin America & Caribbean (excluding high income)Latin America & the Caribbean (IDA & IBRD countries)LatviaLeast developed countries: UN classificationLebanonLesothoLiberiaLibyaLithuaniaLow & middle incomeLow incomeLower middle incomeLuxembourgMacao SAR, ChinaMacedonia, FYRMadagascarMalawiMalaysiaMaldivesMaliMaltaMarshall IslandsMauritaniaMauritiusMexicoMicronesia, Fed. Sts.Middle East & North AfricaMiddle East & North Africa (excluding high income)Middle East & North Africa (IDA & IBRD countries)Middle incomeMoldovaMongoliaMontenegroMoroccoMozambiqueMyanmarNamibiaNepalNetherlandsNew CaledoniaNew ZealandNicaraguaNigerNigeriaNorth AmericaNorwayOECD membersOmanOther small statesPacific island small statesPakistanPalauPanamaPapua New GuineaParaguayPeruPhilippinesPolandPortugalPost-demographic dividendPre-demographic dividendQatarRomaniaRussian FederationRwandaSamoaSao Tome and PrincipeSaudi ArabiaSenegalSerbiaSeychellesSierra LeoneSingaporeSint Maarten (Dutch part)Slovak RepublicSloveniaSmall statesSolomon IslandsSouth AfricaSouth AsiaSouth Asia (IDA & IBRD)South SudanSpainSri LankaSt. Kitts and NevisSt. LuciaSt. Vincent and the GrenadinesSub-Saharan Africa Sub-Saharan Africa (excluding high income)Sub-Saharan Africa (IDA & IBRD countries)SudanSurinameSwazilandSwedenSwitzerlandSyrian Arab RepublicTajikistanTanzaniaThailandTimor-LesteTogoTongaTrinidad and TobagoTunisiaTurkeyTuvaluUgandaUkraineUnited KingdomUnited StatesUpper middle incomeUruguayVanuatuVenezuela, RBWest Bank and GazaWorldYemen, Rep.ZambiaZimbabwe Linha do tempo:
Nesta escala de tempo está apresentado um gráfico de 1978 ano até 2015 ano Sub-Saharan Africa . Dados de 1977 ano ausente. O número de observações reais por data: 38.
Fonte (nome):
Indicadores de desenvolvimento mundial
Fonte (organização):
International Monetary Fund, Balance of Payments Statistics Yearbook and data files.
Categorias:
Economy & Growth, Trade
Foi atualizado:
23 abr 2017 ano
Indicadores de alterações dos valores ao longo dos anos
Mínimo:
33.111
1 jan 1982 ano
Máximo:
46.935
1 jan 2015 ano
Na data de observação
Valor
Mudança absoluta
A alteração em relação ao valor anterior
1 jan 1978 ano
37.731
+37.731
0.0%
1 jan 1979 ano
33.835
-3.896
-10.33%
1 jan 1980 ano
37.685
+3.85
11.38%
1 jan 1981 ano
36.1
-1.585
-4.21%
1 jan 1982 ano
33.111
-2.989
-8.28%
1 jan 1983 ano
34.385
+1.274
3.85%
1 jan 1984 ano
36.413
+2.029
5.9%
1 jan 1985 ano
36.662
+0.249
0.68%
1 jan 1986 ano
39.304
+2.642
7.21%
1 jan 1987 ano
35.83
-3.474
-8.84%
1 jan 1988 ano
35.793
-0.037
-0.1%
1 jan 1989 ano
34.511
-1.281
-3.58%
1 jan 1990 ano
33.265
-1.246
-3.61%
1 jan 1991 ano
35.969
+2.704
8.13%
1 jan 1992 ano
33.488
-2.481
-6.9%
1 jan 1993 ano
34.491
+1.002
2.99%
1 jan 1994 ano
38.683
+4.192
12.16%
1 jan 1995 ano
36.58
-2.103
-5.44%
1 jan 1996 ano
40.757
+4.177
11.42%
1 jan 1997 ano
44.63
+3.873
9.5%
1 jan 1998 ano
39.014
-5.616
-12.58%
1 jan 1999 ano
40.05
+1.036
2.65%
1 jan 2000 ano
40.251
+0.201
0.5%
1 jan 2001 ano
40.064
-0.187
-0.46%
1 jan 2002 ano
43.513
+3.449
8.61%
1 jan 2003 ano
43.813
+0.3
0.69%
1 jan 2004 ano
36.718
-7.096
-16.2%
1 jan 2005 ano
36.63
-0.087
-0.24%
1 jan 2006 ano
38.654
+2.023
5.52%
1 jan 2007 ano
39.734
+1.08
2.8%
1 jan 2008 ano
40.349
+0.615
1.55%
1 jan 2009 ano
38.178
-2.171
-5.38%
1 jan 2010 ano
42.622
+4.443
11.64%
1 jan 2011 ano
40.637
-1.984
-4.66%
1 jan 2012 ano
43.591
+2.953
7.27%
1 jan 2013 ano
41.738
-1.852
-4.25%
1 jan 2014 ano
43.492
+1.754
4.2%
1 jan 2015 ano
46.935
+3.442
7.91%
Classificação de países por estatísticas atuais por anos


Comentários: