29
/pt/
pt
AIzaSyAYiBZKx7MnpbEhh9jyipgxe19OcubqV5w
April 1, 2024
40563
Late-demographic dividend
LTE
false
2
1
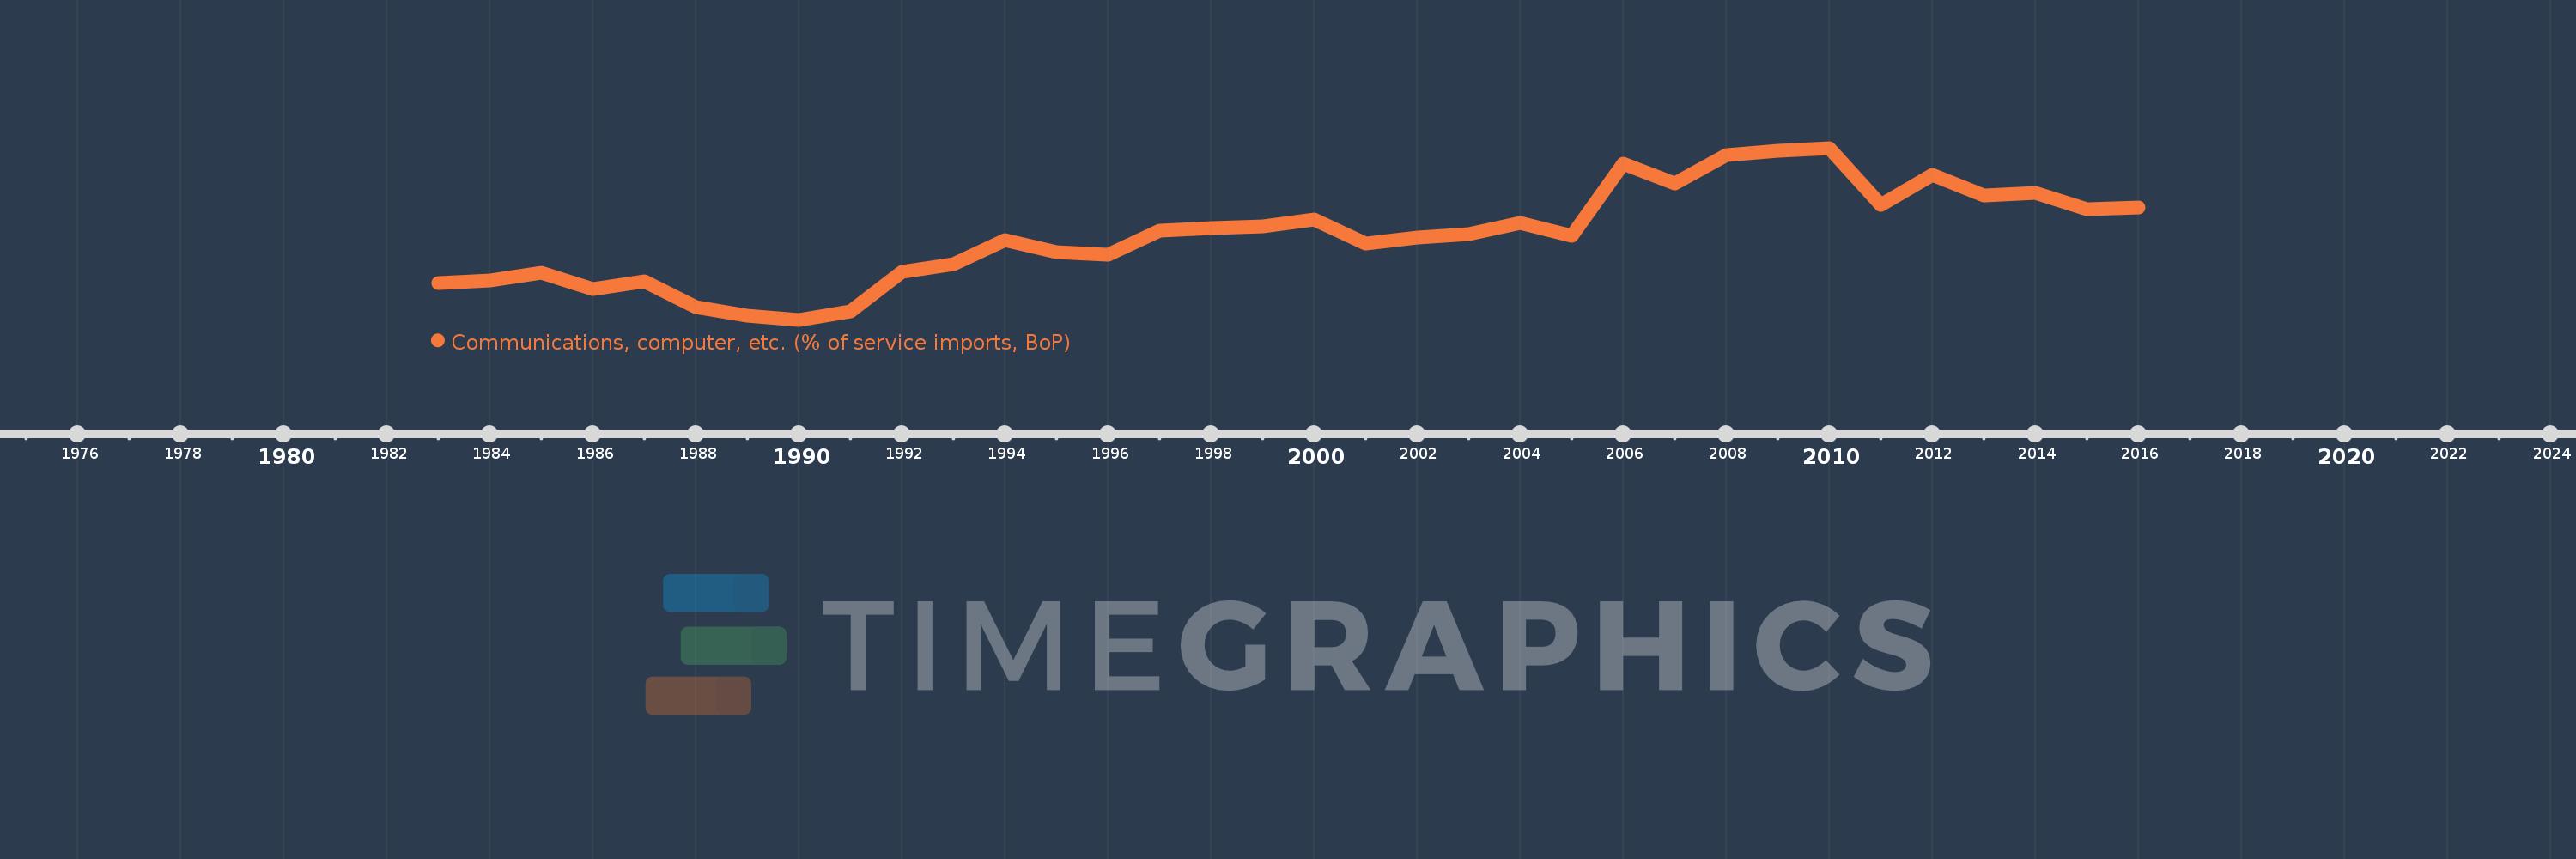
Communications, computer, etc. (% of service imports, BoP)
2016,2015,2014,2013,2012,2011,2010,2009,2008,2007,2006,2005,2004,2003,2002,2001,2000,1999,1998,1997,1996,1995,1994,1993,1992,1991,1990,1989,1988,1987,1986,1985,1984,1983
Estas estatísticas em outros países:
AfghanistanAlbaniaAlgeriaAngolaAntigua and BarbudaArab WorldArgentinaArmeniaArubaAustraliaAustriaAzerbaijanBahamas, TheBahrainBangladeshBarbadosBelarusBelgiumBelizeBeninBermudaBhutanBoliviaBosnia and HerzegovinaBotswanaBrazilBrunei DarussalamBulgariaBurkina FasoBurundiCabo VerdeCambodiaCameroonCanadaCaribbean small statesCentral African RepublicCentral Europe and the BalticsChadChileChinaColombiaComorosCongo, Dem. Rep.Congo, Rep.Costa RicaCote d'IvoireCroatiaCuracaoCyprusCzech RepublicDenmarkDjiboutiDominicaDominican RepublicEarly-demographic dividendEast Asia & PacificEast Asia & Pacific (excluding high income)East Asia & Pacific (IDA & IBRD countries)EcuadorEgypt, Arab Rep.El SalvadorEquatorial GuineaEritreaEstoniaEthiopiaEuro areaEurope & Central AsiaEurope & Central Asia (excluding high income)Europe & Central Asia (IDA & IBRD countries)European UnionFaroe IslandsFijiFinlandFragile and conflict affected situationsFranceFrench PolynesiaGabonGambia, TheGeorgiaGermanyGhanaGreeceGrenadaGuatemalaGuineaGuinea-BissauGuyanaHaitiHeavily indebted poor countries (HIPC)High incomeHondurasHong Kong SAR, ChinaHungaryIBRD onlyIcelandIDA & IBRD totalIDA onlyIDA totalIndiaIndonesiaIran, Islamic Rep.IraqIrelandIsraelItalyJamaicaJapanJordanKazakhstanKenyaKiribatiKorea, Rep.KosovoKuwaitKyrgyz RepublicLao PDRLate-demographic dividendLatin America & Caribbean Latin America & Caribbean (excluding high income)Latin America & the Caribbean (IDA & IBRD countries)LatviaLeast developed countries: UN classificationLebanonLesothoLiberiaLibyaLithuaniaLow & middle incomeLow incomeLower middle incomeLuxembourgMacao SAR, ChinaMacedonia, FYRMadagascarMalawiMalaysiaMaldivesMaliMaltaMarshall IslandsMauritaniaMauritiusMexicoMicronesia, Fed. Sts.Middle East & North AfricaMiddle East & North Africa (excluding high income)Middle East & North Africa (IDA & IBRD countries)Middle incomeMoldovaMongoliaMontenegroMoroccoMozambiqueMyanmarNamibiaNepalNetherlandsNew CaledoniaNew ZealandNicaraguaNigerNigeriaNorth AmericaNorwayOECD membersOmanOther small statesPacific island small statesPakistanPalauPanamaPapua New GuineaParaguayPeruPhilippinesPolandPortugalPost-demographic dividendPre-demographic dividendQatarRomaniaRussian FederationRwandaSamoaSao Tome and PrincipeSaudi ArabiaSenegalSerbiaSeychellesSierra LeoneSingaporeSint Maarten (Dutch part)Slovak RepublicSloveniaSmall statesSolomon IslandsSouth AfricaSouth AsiaSouth Asia (IDA & IBRD)South SudanSpainSri LankaSt. Kitts and NevisSt. LuciaSt. Vincent and the GrenadinesSub-Saharan Africa Sub-Saharan Africa (excluding high income)Sub-Saharan Africa (IDA & IBRD countries)SudanSurinameSwazilandSwedenSwitzerlandSyrian Arab RepublicTajikistanTanzaniaThailandTimor-LesteTogoTongaTrinidad and TobagoTunisiaTurkeyTuvaluUgandaUkraineUnited KingdomUnited StatesUpper middle incomeUruguayVanuatuVenezuela, RBWest Bank and GazaWorldYemen, Rep.ZambiaZimbabwe Linha do tempo:
Nesta escala de tempo está apresentado um gráfico de 1983 ano até 2016 ano Late-demographic dividend. Dados de 1982 ano ausente. O número de observações reais por data: 34.
Fonte (nome):
Indicadores de desenvolvimento mundial
Fonte (organização):
International Monetary Fund, Balance of Payments Statistics Yearbook and data files.
Categorias:
Economy & Growth, Trade
Foi atualizado:
23 abr 2017 ano
Indicadores de alterações dos valores ao longo dos anos
Mínimo:
25.074
1 jan 1990 ano
Máximo:
45.183
1 jan 2010 ano
Na data de observação
Valor
Mudança absoluta
A alteração em relação ao valor anterior
1 jan 1983 ano
29.397
+29.397
0.0%
1 jan 1984 ano
29.667
+0.27
0.92%
1 jan 1985 ano
30.613
+0.946
3.19%
1 jan 1986 ano
28.639
-1.974
-6.45%
1 jan 1987 ano
29.555
+0.917
3.2%
1 jan 1988 ano
26.51
-3.046
-10.3%
1 jan 1989 ano
25.513
-0.996
-3.76%
1 jan 1990 ano
25.074
-0.44
-1.72%
1 jan 1991 ano
26.039
+0.965
3.85%
1 jan 1992 ano
30.71
+4.671
17.94%
1 jan 1993 ano
31.613
+0.903
2.94%
1 jan 1994 ano
34.377
+2.764
8.74%
1 jan 1995 ano
32.952
-1.424
-4.14%
1 jan 1996 ano
32.717
-0.235
-0.71%
1 jan 1997 ano
35.507
+2.79
8.53%
1 jan 1998 ano
35.765
+0.258
0.73%
1 jan 1999 ano
36.053
+0.288
0.81%
1 jan 2000 ano
36.845
+0.792
2.2%
1 jan 2001 ano
34.013
-2.832
-7.69%
1 jan 2002 ano
34.654
+0.641
1.88%
1 jan 2003 ano
35.133
+0.479
1.38%
1 jan 2004 ano
36.44
+1.307
3.72%
1 jan 2005 ano
34.859
-1.581
-4.34%
1 jan 2006 ano
43.299
+8.44
24.21%
1 jan 2007 ano
41.062
-2.237
-5.17%
1 jan 2008 ano
44.322
+3.261
7.94%
1 jan 2009 ano
44.823
+0.501
1.13%
1 jan 2010 ano
45.183
+0.36
0.8%
1 jan 2011 ano
38.542
-6.642
-14.7%
1 jan 2012 ano
42.084
+3.542
9.19%
1 jan 2013 ano
39.621
-2.463
-5.85%
1 jan 2014 ano
39.884
+0.263
0.66%
1 jan 2015 ano
38.015
-1.869
-4.69%
1 jan 2016 ano
38.169
+0.153
0.4%
Classificação de países por estatísticas atuais por anos


Comentários: